October 26, 2023
Net Zero Consortium for Buyers U.S. VPPA Opportunity Index: 2023 Q3
SR Inc was pleased to guide and represent more than a dozen Member-Clients in independent and aggregated virtual power purchase agreements (VPPAs) through the Net Zero Consortium for Buyers (NZCB) in Q3 2023, closing six individual VPPA contracts for to-be-built solar farms in both the U.S. and Europe, which will soon be announced publicly. One large VPPA the NZCB closed in Q3 in Spain was part of an inflecting trend among NZCB Members to advance their Scope 3 strategies by having the NZCB help organize and represent their value chains (suppliers and/or customers) in aggregated VPPAs, what NZCB members describe as “VPPA 2.0.”
Like most companies, most SR Inc Member-Clients have electric loads that are not geographically concentrated and, therefore, they are keenly interested in the impact and scalability of VPPAs. Most Member-Clients, even if they aggregated their load across the U.S. / Canada or AIB countries, can only smartly pursue VPPAs if they also aggregate their procurement with other high-credit corporates to increase their economies of scale, experience, and intellect to be able to command the most Corporate Buyer-favorable transaction structuring, ESG impact terms, and price. This is why the NZCB’s auditable corporate procurement process and Reverse Auctions have become core to a growing number of SR Inc Member-Clients’ decarbonization strategies.
Although conditions in the North American VPPA market have eased for corporate buyers in 2023 versus 2022, developers are continuing to face interconnection backlogs, transmission constraints, concerns about basis risk and severe weather, and higher interest rates. These factors, in addition to record high corporate interest in long-term corporate contracting for to-be-built, utility-scale renewable energy, has led to continued increased VPPA pricing in the U.S. market overall in Q3 2023.
We have seen growing concern about the reputational risks of “Unbundled RECs” driving the attractiveness of purchaser caused RECs (REC purchases that cause new utility scale capacity) and their pricing. Corporates are demonstrating a willingness to pay for far more credible RECs from which they have an unequivocal claim to having helped caused to be built. The cost of purchaser caused RECs rose about $12.50 per REC on average across all U.S. hubs over the last two years as buyer demand grew to 12 to 16 GW annually. While two years ago, the average VPPA price could yield modest cash savings to a corporate offtaker (on average $2.50), the average cost of a purchaser caused REC across the U.S. today is approximately $10. SR Inc procurements achieve significantly better results than that due to the competitive process and reverse auction bidding, but it is clear that the demand for purchaser caused RECs as well as industry cost increases has driven these costs up sharply over the last two years.
This growing demand for purchaser caused RECs is causing renewables to exceed all forecasts and scale throughout both the U.S. and Europe. The success has been so dramatic that it has inspired policymakers to invest in renewables like never before, and the EU and Commonwealth nations are now trying to match or beat the U.S. visionary Inflation Reduction Act (IRA) with their own long-term subsidies for domestic renewables and battery industries. As developers continue to evaluate exactly how their projects could benefit from these government incentives, SR Inc has seen a move from a pronounced sellers’ market to a more balanced market, wherein the best positioned, and most ambitious developers are willing to pass on lower costs to Buyers.
Another factor that SR Inc monitors closely when advising clients on VPPAs is historical and projected earned wind and solar prices across hubs. In Q3 versus Q2, our 22-year earned price indicator increased 2.2% for wind and increased 1.0% for solar across active VPPA hubs, largely because of record heat waves and air conditioning spikes this summer. Over the longer term, as the country electrifies, overall electricity demand is expected to continue to rise, increasing the need for clean energy and its associated infrastructure (estimates suggest electrification trends by themselves will result in a 2.5X increase from our current electricity demand). This rise in demand is expected to largely offset (likely through additional natural gas capacity) downward price pressure due to more renewable energy (with zero marginal costs) being added to the grid.
To better quantify these market dynamics, the NZCB has published the NZCB VPPA Opportunity Index quarterly starting in 2019 to help advance our mission to accelerate the development and adoption of best practices in more sustainable business. The NZCB VPPA Opportunity Index enables a comparison of potential wind and solar VPPA performance across U.S. hubs using common analytics. It reflects both prior actual (backcast) performance and forward carefully modeled pricing and is based on proprietary SR Inc analytics and key data sources including those provided by SR Inc partners LevelTen Energy and REsurety. We call readers’ attention to the fact that the Index is based upon VPPA offers, not executed transactions, that were made over the prior quarter.
Key findings from our Q3 analysis include:
- Top quartile offered wind VPPA prices across the country were up 7% on average from the previous 12 months, while offered solar VPPA prices were up 9%.
- Realized electricity prices have continued to correct down to more historically typical levels. Average trailing 12 month (TTM) realized wind electricity prices in Q3 2023 were down 22% across active hubs from the TTM in Q3 2022 and realized solar electricity prices were down 36% from the very high levels in Q3 2022.
- The combination of higher VPPA prices and lower realized prices led the expected cashflows in the TTM for a 10MW wind VPPA to drop from $172K in Q3 2022 to $(462K) in Q3 2023 (drop of $634K) and expected cashflows for a 10MW solar VPPA to drop from $617K in Q3 2022 to $(292K) in Q3 2023 (a drop of $909K).
- Our longer-term view Opportunity Index shows that average modeled cashflow through Q3 2038 per 10MW VPPA across active hubs increased $79K in Q3 versus Q2 2023 for wind and decreased $51K for solar (excluding the first ever VPPA offer in New Hampshire, which was over $45/MWh out of the money).
- In Q3, wind VPPAs modeled to be less expensive in 29% of all active hubs versus buying impact-inferior bundled RECs (based on the typical minimum cost today of $10 per REC), and solar VPPAs modeled to be less expensive than impact-inferior bundled RECs in 50% of all hubs.
- The average modeled hub annual cashflow for a 10MW wind VPPA would have been $92K more expensive than buying the equivalent number of local bundled RECs, and the average modeled hub annual cashflow for a 10MW solar VPPA would have been $15K more expensive (excluding NH).
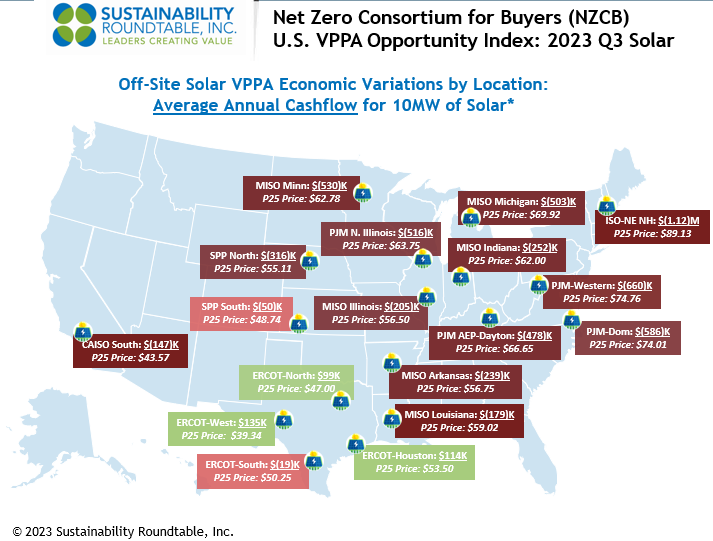
- Price modeling shows that ERCOT (most of Texas) solar continued to present modeled opportunities for better than breakeven cash flow in Q3. The average modeled ERCOT annual cashflow for a 10MW solar VPPA was $82K.
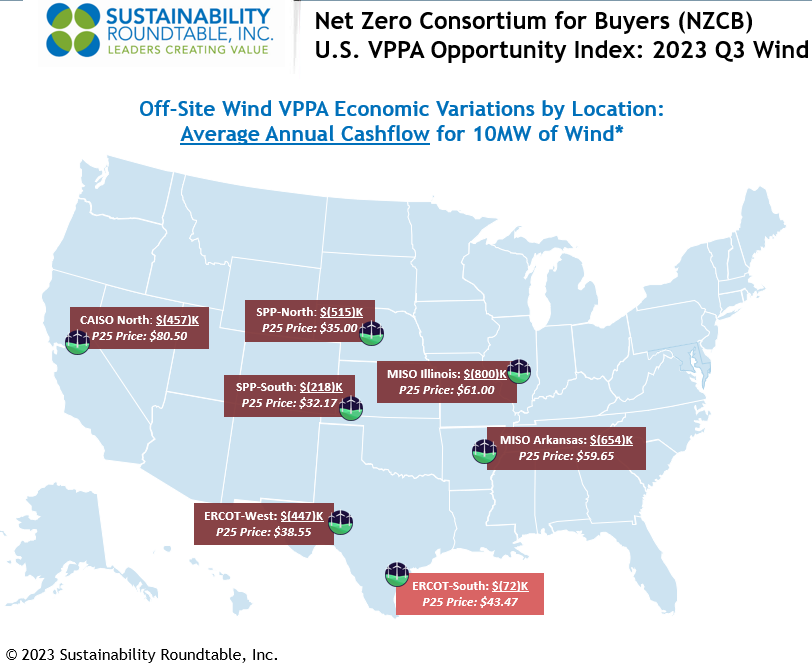
- For wind VPPAs in Q3, price modeling shows that ERCOT South presented the best annual cashflow opportunity, which was negative $72K per 10MW.
- To underscore the importance of NZCB’s procurement process, 2023 Q3 NZCB procurements for to-be-built solar in ERCOT North and MISO Illinois were in contract negotiations for or closed VPPA prices on average about 15% below the average offered Q3 P25 VPPA prices.
The NZCB VPPA Opportunity Index is an intentionally simplified rendering of complex markets, but NZCB participants find it helpful in beginning to gain an understanding of VPPA market dynamics and financial implications for implementing their renewable energy strategies through VPPAs and aggregated VPPAs. In pursuing any specific VPPA opportunities, SR Inc works with NZCB participants to provide deep stakeholder briefings and detailed and custom analytics before transacting. This type of assistance that VPPA offtakers need requires financial, legal, and market expertise to drive timely procurement strategy development and implementation, transaction structuring, contracting, and negotiation services to create a successful and auditable corporate procurement process in rapidly changing markets.
*Methodology
- To calculate average annual cashflows, SR Inc multiplies 1) the difference of technology-shaped realized market prices (2016-2023) & forecasted technology-shaped electricity futures market prices (2023-2038) versus top quartile VPPA prices in each hub by 2) the typical total annual production for 10MW offtakes for wind and solar, respectively.
- SR Inc uses 36K MWh production per year for 10MW of wind and 24K MWh per year for 10MW of solar to provide “apples to apples” comparisons for both technologies across hubs.
- The top quartile VPPA price assumes a scaled offtake of at least 50MW, but SR Inc uses 10MW because it is typically the minimum individual corporate offtake required within 100+ MW aggregated procurements REPS manages for NZCB participants.
Data Sources
- The NZCB Opportunity Index is developed from proprietary analytics and multiple data providers, which include:
-
- LevelTen Energy PPA Price Index North America top quartile VPPA pricing data for Q3 2023 (all proposed projects of 8+ years)
- REsurety REmap actual average, technology-shaped realized market prices for Q4 2016-Q3 2023 and technology-shaped future market price forecasts for Q4 2023-Q3 2038 (as of October 16th, 2023) based on multiple electricity futures markets.
If you have any additional questions, or would like to learn more about the NZCB, contact info@sustainround.com.