February 1, 2024
Net Zero Consortium for Buyers U.S. VPPA Opportunity Index: 2023 Q4
SR Inc was pleased to guide and represent more than two dozen Member-Clients in aggregated virtual power purchase agreements (VPPAs) through the Net Zero Consortium for Buyers (NZCB) in Q4 2023. While we look forward to announcing one of the largest ever peer buyer organized aggregated VPPAs in the next quarter, the NZCB was pleased to announce in Q4 a large value chain aligned VPPA in Spain with Thermo Fisher Scientific and Eurofins. The NZCB is well on its way to substantially exceeding its goal of causing a gigawatt of new renewable energy capacity before 2025.
Most SR Inc Member-Clients, like most global companies, have geographically dispersed electric loads and are therefore keenly interested in the impact and scalability of VPPAs. This is particularly true in the U.S. / Canada and the AIB countries in Europe, where greenhouse gas accounting rules allow them to source renewables and apply the associated energy attribute certificates to any sites within the respective boundaries. Furthermore, even when most SR Inc Member-Clients aggregate their load across the U.S. / Canada or the AIB countries in Europe, they still lack sufficient scale to command the most corporate buyer-favorable transaction structuring, ESG impact terms, and price when contracting through VPPAs.
Fortunately, SR Inc Member-Clients are able to come together with the assistance of SR Inc’s NZCB to create economies of scale, experience, and intellect. NZCB’s auditable corporate procurement process and Reverse Auctions have become core to a growing number of SR Inc Member-Clients’ decarbonization strategies. SR Inc Member-Clients have made the NZCB the leading platform for corporate buyer aggregated procurement of utility-scale renewable energy in the U.S. as they help democratize their environmental and financial benefits, previously reserved only for the world’s largest energy users with geographically concentrated demand.
Although conditions in the U.S. VPPA market eased for corporate buyers in 2023 versus 2022, developers are continuing to face interconnection backlogs, transmission constraints, concerns about basis risk and severe weather, and perhaps most importantly, higher interest rates. These factors – in addition to record high corporate interest in long-term corporate contracting for to-be-built, utility-scale renewable energy – led to continued increases in VPPA pricing in the U.S. market overall in Q4 2023.
However, recent signaling from the U.S. Federal Reserve have also helped decrease financing rates, leading the upward trend in the trailing 12 month 10-year Treasury rate – a key indicator for developer financing costs – to stabilize in Q4. Additionally, easing supply chain pressures (including developers in the U.S. onshoring production to take advantage of the Inflation Reduction Act and avoid tariff risk) may contribute to VPPA price stability or even price reductions going forward.
We have seen growing concern about the reputational risks of “Unbundled RECs” driving the attractiveness of purchaser caused RECs (a REC generated from a project caused by its procurement as part of a long-term transaction that enabled the project to get financed). Corporates are demonstrating a willingness to pay for more credible RECs from which they have an unequivocal claim to having helped cause to be built. The modeled cost of buyer favorable, VPPA-sourced RECs rose more than $15 per REC on average across all U.S. hubs over the last year and a half as the volume of closed VPPA transactions remains high (closed deals rose to 16GW in 2022 and was on a similar pace in 2023). While a year and a half ago, the average modeled VPPA price could yield breakeven financials to a corporate offtaker, the average modeled cost of a purchaser caused REC across the U.S. today exceeds $15. SR Inc procurements achieve significantly better results than that due to professionally managed U.S. and European competitions culminating in a Reverse Auction that is shaped to benefit corporate procurement. But it is clear that these costs are up sharply over the last two years due to continued high demand for purchaser caused RECs; continuing supply chain, permitting, and transmission constraints; and increased financing costs.
Another factor SR Inc’s NZCB monitors closely is historical and projected earned wind and solar prices across hubs. In Q4 versus Q3, our 22-year earned price indicator decreased 8.4% for wind and decreased 0.3% for solar across active VPPA hubs, largely because of record heat waves and air conditioning spikes in Q3. Over the longer term, as the country electrifies, overall electricity demand is expected to continue to rise, increasing the need for clean energy and its associated infrastructure (estimates suggest electrification will double our current electricity demand by 2050). Recent proposed rules from the IRS on green hydrogen – plus data center, AI, and crypto trends – also portend a spike in demand for electricity and EACs. This rise in demand is expected to be largely (or more than) offset by downward price pressure due to more renewable energy (with zero marginal costs) being added to the grid. As a result, SR Inc’s NZCB remains conservative on forward price modeling and skeptical of overly optimistic price forecasts. Sophisticated leaders in technological change participating in the NZCB see promise in non-linear improvements in long-term energy storage, high-heat thermal batteries, geothermal, and gravity-based storage as well as modest but impactful alternative transmission technologies all helping renewables reduce the structural cost of energy even as electrification exponentially increases demand.
To better quantify VPPA market dynamics in the U.S., the NZCB has published the NZCB VPPA Opportunity Index quarterly since 2019 to help advance SR Inc’s mission to accelerate the development and adoption of best practices in more sustainable business. The NZCB VPPA Opportunity Index enables a comparison of potential wind and solar VPPA performance across U.S. hubs using common analytics. It reflects both prior actual (backcast) performance and forward carefully modeled pricing and is based on proprietary SR Inc analytics and key data sources including those provided by SR Inc data providers LevelTen Energy and REsurety. We call readers’ attention to the fact that the Index is based upon VPPA offers, not executed transactions, that were made over the prior quarter.
Key findings from SR Inc’s NZCB Q4 analysis include:
- Top quartile offered wind VPPA prices across the country were up 11% on average from the previous 12 months, while offered solar VPPA prices were up 7%.
- Realized electricity prices have continued to correct down to more historically typical levels. Average trailing 12 month (TTM) realized wind electricity prices in Q4 2023 were down 47% (to $26.35) across active hubs from the TTM in Q4 2022 and realized solar electricity prices were down 46% (to $40.59) from the very high levels in Q4 2022.
- The combination of higher VPPA prices and lower realized prices led the expected cashflows in the TTM for a 10MW wind VPPA to drop from $262K in Q4 2022 to $(986K) in Q4 2023 (drop of $1.2M) and expected cashflows for a 10MW solar VPPA to drop from $648K in Q4 2022 to $(419K) in Q4 2023 (a drop of $1.1M).
- Our longer-term view Opportunity Index shows that average modeled cashflow through Q4 2038 per 10MW VPPA across active hubs decreased $331K in Q4 (to negative $783) versus Q3 2023 for wind and increased $27K (to negative $276K) for solar.
- In Q4, wind VPPAs modeled to be less expensive in 11% of all active hubs versus buying less impactful unbundled RECs (based on the typical average cost today of $6 for a 10-year strip of unbundled RECs), and solar VPPAs modeled to be less expensive in 31% of all hubs.
- The average modeled hub annual cashflow for a 10MW wind VPPA would have been $567K more expensive than buying the equivalent number of less impactful unbundled RECs, and the average modeled hub annual cashflow for a 10MW solar VPPA would have been $132K more expensive.
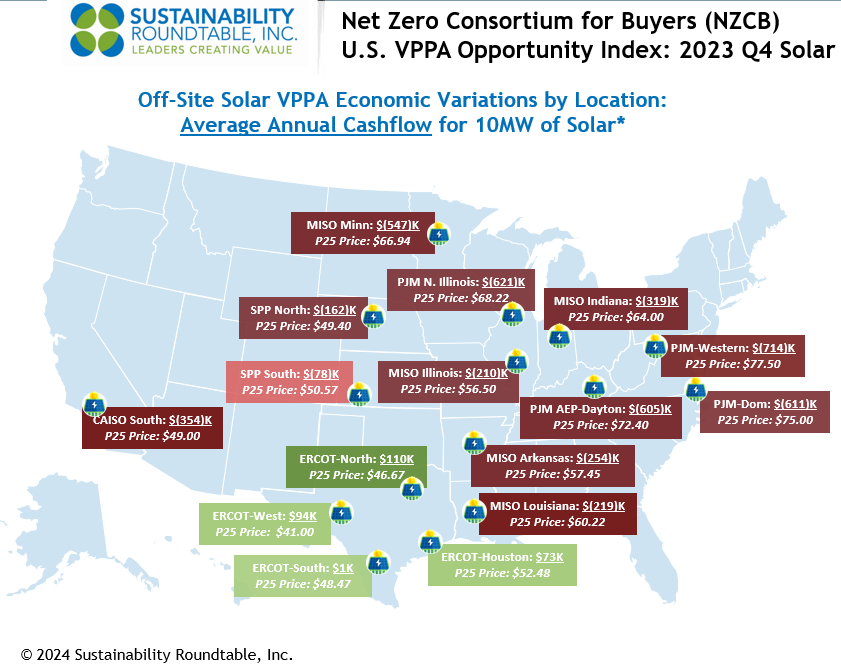
- Price modeling shows that ERCOT (most of Texas) solar continued to present modeled opportunities for better than breakeven cash flow in Q4. The average modeled ERCOT annual cashflow for a 10MW solar VPPA was $69K.
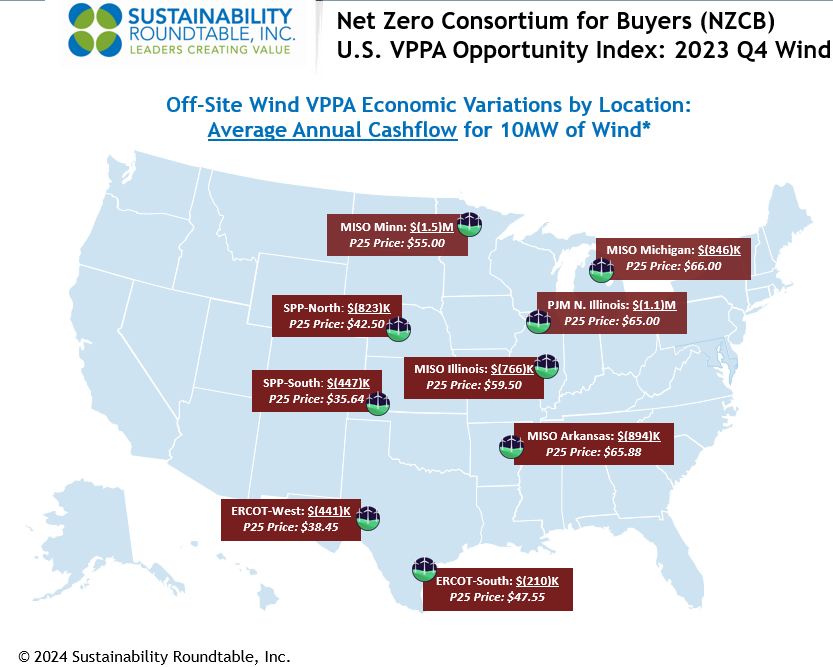
- For wind VPPAs in Q4, price modeling shows that ERCOT South presented the best annual cashflow opportunity, which was negative $210K per 10MW.
- To underscore the importance of NZCB’s procurement process, 2023 Q4 NZCB procurements for to-be-built solar in ERCOT were on average about 5-10% below the average offered Q4 P25 VPPA prices for the same hubs despite also providing more than a dozen specially sought and secured risk management terms required by conservative, environmentally motivated corporate procurement teams.
The NZCB VPPA Opportunity Index is an intentionally simplified rendering of complex markets, but NZCB participants find it helpful in beginning to gain an understanding of VPPA market dynamics and financial implications for implementing their renewable energy strategies through VPPAs and aggregated VPPAs. In pursuing any specific VPPA opportunities, SR Inc works with NZCB participants to provide deep stakeholder briefings and detailed and custom analytics before transacting. This type of assistance that VPPA offtakers need requires financial, legal, and market expertise to drive timely procurement strategy development and implementation, transaction structuring, contracting, and negotiation services to create a successful and auditable corporate procurement process in rapidly changing markets.
*Methodology
- To calculate average annual cashflows, SR Inc multiplies 1) the difference of technology-shaped realized market prices (2017-2023) & forecasted technology-shaped electricity futures market prices (2024-2038) versus top quartile VPPA prices in each hub by 2) the typical total annual production for 10MW offtakes for wind and solar, respectively.
- SR Inc uses 36K MWh production per year for 10MW of wind and 24K MWh per year for 10MW of solar to provide “apples to apples” comparisons for both technologies across hubs.
- The top quartile VPPA price assumes a scaled offtake of at least 50MW, but SR Inc uses 10MW because it is typically the minimum individual corporate offtake required within 100+ MW aggregated procurements REPS manages for NZCB participants.
Data Sources
- The NZCB Opportunity Index is developed from proprietary analytics and multiple data providers, which include:
-
- LevelTen Energy PPA Price Index North America top quartile VPPA pricing data for Q4 2023 (all proposed projects of 8+ years)
- REsurety REmap actual average, technology-shaped realized market prices for Q1 2017-Q4 2023 and technology-shaped future market price forecasts for Q1 2024-Q4 2038 (as of January 22, 2024) based on multiple electricity futures markets.
If you have any additional questions, or would like to learn more about the NZCB, contact info@sustainround.com.