April 23, 2024
Net Zero Consortium for Buyers U.S. VPPA Opportunity Index: 2024 Q1
NZCB “From the Front”: Strategic Patience Pays
North America’s leading data service providing virtual power purchase agreement (VPPA) proposals reports a 1% decline in proposed solar VPPA prices and a 2% rise in wind VPPA prices in the first quarter compared to the prior quarter. These modest figures obscure the extent of the substantial reversal of the corporate VPPA market back towards greater equilibrium between corporate offtakers and developers. Since the Inflation Reduction Act (IRA) was signed into law in August 2022, SR Inc has been predicting a likely rebalancing of the North American VPPA market by the second quarter of 2024. It just arrived.
Over the last three years, proposed and largely permitted North American utility scale solar projects have regularly presented stronger financial opportunities than wind projects. ERCOT solar – and ERCOT North solar in particular (the settlement hub that contains the robustly growing Dallas region of Texas) – has attracted the most corporate VPPA offtaker attention. Consequently, it is important and informing to focus on solar there. There was a 6% decline in offered ERCOT North solar VPPA prices in Q1 2024 compared to the prior four quarters. That is consistent with SR Inc’s Net Zero Consortium for Buyers (NZCB) experience in Q1 2024 including a Q1-closed seven-buyer Aggregated Procurement for solar with settlement on that hub. NZCB Aggregated Procurement participants have received both superior, buyer-favorable transaction structuring terms and pricing because they strategically slowed their procurement process in late Q4 and so far in 2024. As further evidence of this trend reversal, a separate current SR-led Aggregated Procurement has negotiated continued improvement in transaction terms and pricing for ERCOT North solar.
Although many speak of the need to accelerate the VPPA procurement process (which can continue to become more efficient), the reality is that time is one of the buyers’ key negotiating levers. Sellers have mature development assets in which they have invested considerable time and money that they must sell. Their originators will be replaced if they cannot contract in a timely fashion to facilitate project financing. Conversely, corporate procurement and sustainability executives representing corporate offtakers have time on their side if they have been well advised. If they are seeking their first VPPA, they will benefit from approaching the market 36 months from needed Commercial Operation Date. That will provide up to a year for the leadership of their global organizations to understand the changing dynamics of the market and a year to qualify and select the most mature projects with or close to obtaining their interconnection agreements. Significantly, it will also empower the buyers to delay before entering an important, but non-binding, Letter of Intent with detailed Term Sheet and a 60-to-90-day period of exclusive negotiations.
This approach empowered a recent North American NZCB Aggregated Procurement to delay for a month to perform due diligence on late arriving proposals in what appeared to be an improving market. This strategic delay has enabled the buyer group to head towards exclusive negotiations with one of multiple impressively experienced and referenced developers providing superior terms and price than those offered at the beginning of 2024. But make no mistake, the NZCB can and does act with alacrity when the market will reward it, which is why this buyer group is closing promptly with either the Prevailing Proposal, or if it falters, the Second Selected. After smart and exhaustive documented diligence, the NZCB is closing in on its goal of causing a gigawatt of new renewable energy capacity before 2025. This goal will be exceeded with this next transaction that is targeted to close in Q3 to stay ahead of political uncertainty surrounding this year’s presidential election that could stall long-planned procurements.
The NZCB General Quarterly Update
Most SR Inc Member-Clients, like most global companies, have geographically dispersed electric loads and are therefore keenly interested in the impact and scalability of VPPAs. This is particularly true in the U.S. / Canada and the AIB countries in Europe, where GHG accounting rules allow them to source renewables and apply the associated energy attribute certificates to any sites within the respective boundaries. Furthermore, even when most SR Inc Member-Clients aggregate their load across the U.S. / Canada or the AIB countries in Europe, they still lack sufficient scale to command the most corporate buyer-favorable transaction structuring, ESG impact terms, and price when contracting through VPPAs.
Fortunately, SR Inc Member-Clients are able to come together with the assistance of SR Inc’s NZCB to create economies of scale, experience, and intellect. NZCB’s auditable corporate procurement process and Reverse Auctions have become core to a growing number of SR Inc Member-Clients’ decarbonization strategies. SR Inc Member-Clients have made the NZCB the leading platform for corporate buyer aggregated procurement of utility-scale renewable energy in the U.S. as they help democratize their environmental and financial benefits, previously reserved only for the world’s largest energy users with geographically concentrated demand.
As stated in the first section, conditions in the U.S. VPPA market have eased for corporate buyers in the last few quarters. In SR Inc’s aggregated procurements, we have returned to securing mature projects with full hub settlement, zero price floors, firm pricing, and shorter terms despite the fact that developers are continuing to face interconnection backlogs, transmission constraints, concerns about basis risk, severe weather, insurance costs, and perhaps most importantly, higher interest rates that do not seem to be declining anytime soon due to persistently high inflation levels. These factors – in addition to record high corporate interest in long-term corporate contracting for to-be-built, utility-scale renewable energy – led to VPPA pricing remaining high in the U.S. market overall in Q1 2024. SR Inc is seeing early signs of easing solar supply chain pressures contributing to VPPA price stability or even price reductions. We hope to be able to report on a continued decline in solar VPPA prices in our Q2 Index, yet don’t expect wind VPPAs to be attractive until inflation is under better control and interest rates start to come down.
The growing concern about the reputational risks of “Unbundled RECs” has been driving the increasing demand for purchaser caused RECs (a REC generated from a project caused by its procurement as part of a long-term transaction that enabled the project to get financed) for a few years now. Corporates are demonstrating a willingness to pay for more credible RECs from which they have an unequivocal claim to having helped cause to be built. The modeled cost of buyer favorable, VPPA-sourced RECs rose nearly $12 per REC on average across wind and solar in all U.S. hubs over the last two years as the volume of closed VPPA transactions remains high (closed deals averaged 14GW/year in 2021-2023). While two years ago, the average modeled VPPA price could yield breakeven financials to a corporate offtaker, the average modeled cost of a purchaser caused REC across the U.S. today approached $12 ($7.77 for solar and $15.47 for wind). SR Inc procurements achieve significantly better results than that due to professionally managed U.S. and European competitions culminating in a Reverse Auction that is shaped to benefit corporate procurement.
Another factor SR Inc’s NZCB monitors closely is historical and projected earned wind and solar prices across hubs. In Q1 versus Q4 2023, our 22-year earned price indicator increased 9.5% for wind and increased 8.6% for solar across active VPPA hubs. We are seeing this increase in expected electricity prices continue in early Q2. This trend of increasing prices is partially due to concerns about unrest in Russia, Ukraine, and the Middle East impacting energy prices and partially due to increased forecasts on electricity demand. Recent articles from the New York Times and Wall Street Journal have highlighted a new surge in power usage driven by data center proliferation related to AI and cryptocurrency mining, which is driving unprecedented demand for both renewables and fossil fuels and will likely have an upward pressure on prices. Over the longer term, as the country electrifies and looks to emerging technologies like green hydrogen and battery energy storage, overall electricity demand is expected to continue to rise, increasing the need for clean energy and its associated infrastructure (estimates suggest electrification will double our current electricity demand by 2050). This rise in demand is expected to be largely (or potentially more than) offset by downward price pressure due to more renewable energy (with zero marginal costs) being added to the grid.
To better quantify VPPA market dynamics in the U.S., the NZCB has published the NZCB VPPA Opportunity Index quarterly since 2019 to help advance SR Inc’s mission to accelerate the development and adoption of best practices in more sustainable business. The NZCB VPPA Opportunity Index enables a comparison of potential wind and solar VPPA performance across U.S. hubs using common analytics. It reflects both prior actual (backcast) performance and forward carefully modeled pricing and is based on proprietary SR Inc analytics and key data sources including those provided by SR Inc data providers LevelTen Energy and REsurety. We call readers’ attention to the fact that the Index is based upon VPPA offers, not executed transactions, that were made over the prior quarter.
Key findings from SR Inc’s NZCB Q1 analysis include:
- Top quartile offered wind VPPA prices across the country were up 11% on average from the previous 12 months, while offered solar VPPA prices were up 2%, however, some of the leading markets are beginning to show a downward trend. Most noticeably, offered ERCOT North and South solar prices dropped 6-7% and offered SPP North solar prices dropped 26%. We will be tracking this potential overall change in VPPA price trends during our active North American procurements.
- Realized electricity prices have continued to correct down to more historically typical levels. Average trailing 12 month (TTM) realized wind electricity prices in Q1 2024 were down 45% (to $26.23) across active hubs from the TTM in Q1 2023 and realized solar electricity prices were also down 45% (to $40.42) from Q1 2023.
- The combination of higher VPPA prices and lower realized prices caused expected cashflows in the TTM for a 10MW wind VPPA to drop from $85K in Q1 2023 to $(1.04M) in Q1 2024 (drop of $1.12M) and expected cashflows for a 10MW solar VPPA to drop from $422K in Q1 2023 to $(536K) in Q1 2024 (a drop of $957K).
- Our longer-term view Opportunity Index shows that average modeled cashflow through Q1 2039 per 10MW VPPA across active hubs improved $92K in Q1 (to negative $691K) versus Q4 2023 for wind and improved $37K (to negative $239K) for solar.
- In Q1, wind VPPAs modeled to be less expensive in 11% of all active hubs versus buying less impactful unbundled RECs (based on the typical average cost today of $6 for a 10-year strip of unbundled RECs), and solar VPPAs modeled to be less expensive in 44% of all hubs.
- The average modeled hub annual cashflow for a 10MW wind VPPA would have been $475K more expensive than buying the equivalent number of less impactful in-grid RECs, and the average modeled hub annual cashflow for a 10MW solar VPPA would have been $95K more
- Price modeling shows that ERCOT solar and SPP solar presented modeled opportunities for better than breakeven cash flow in Q1. The average modeled ERCOT & SPP annual cashflow for a 10MW solar VPPA was $255K.
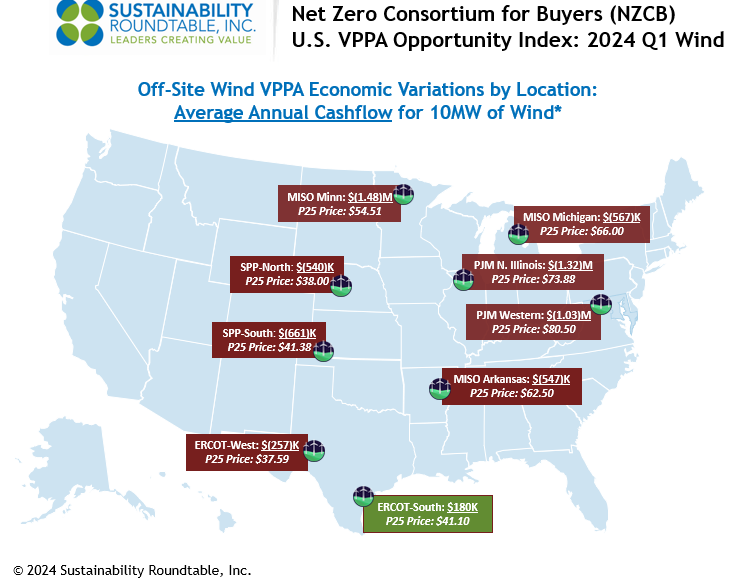
- For wind VPPAs in Q1, price modeling shows that ERCOT South presented modeled opportunities for better than breakeven cash flow in Q1, which was $180K per 10MW.
- To underscore the importance of NZCB’s procurement process, 2024 Q1 NZCB procurements for to-be-built solar in ERCOT were below the Q1 P25 VPPA prices for the same hubs despite also providing more than a dozen specially sought and secured buyer-favorable risk management terms required by conservative, environmentally motivated corporate procurement teams.
The NZCB VPPA Opportunity Index is an intentionally simplified rendering of complex markets, but NZCB participants find it helpful in beginning to gain an understanding of VPPA market dynamics and financial implications for implementing their renewable energy strategies through VPPAs and aggregated VPPAs. In pursuing any specific VPPA opportunities, SR Inc works with NZCB participants to provide deep stakeholder briefings and detailed and custom analytics before transacting. This type of assistance that VPPA offtakers need requires financial, legal, and market expertise to drive timely procurement strategy development and implementation, transaction structuring, contracting, and negotiation services to create a successful and auditable corporate procurement process in rapidly changing markets.

*Methodology
- To calculate average annual cashflows, SR Inc multiplies 1) the difference of technology-shaped realized market prices (2017-2024) & forecasted technology-shaped electricity futures market prices (2024-2039) versus top quartile VPPA prices in each hub by 2) the typical total annual production for 10MW offtakes for wind and solar, respectively.
- SR Inc uses 36K MWh production per year for 10MW of wind and 24K MWh per year for 10MW of solar to provide “apples to apples” comparisons for both technologies across hubs.
- The top quartile VPPA price assumes a scaled offtake of at least 50MW, but SR Inc uses 10MW because it is typically the minimum individual corporate offtake required within 100+ MW aggregated procurements REPS manages for NZCB participants.
Data Sources
- The NZCB Opportunity Index is developed from proprietary analytics and multiple data providers, which include:
- LevelTen Energy PPA Price Index North America top quartile VPPA pricing data for Q1 2024 (all proposed projects of 8+ years)
- REsurety REmap actual average, technology-shaped realized market prices for Q2 2017-Q1 2024 and technology-shaped future market price forecasts for Q2 2024-Q1 2039 (as of April 16, 2024) based on multiple electricity futures markets.
If you have any additional questions, or would like to learn more about the NZCB, contact info@sustainround.com.