October 26, 2021
Net Zero Consortium for Buyers VPPA Opportunity Index: 2021 Q3
Why VPPAs and VPPA2.0?
As a growing number of sustainability leaders know, off-site renewable energy regularly provides the vast bulk of a company’s emission reductions. This is true whether that is done through:
(a) increasingly expensive “unbundled” Renewable Energy Certificates (RECs) often from long existing renewable projects, or
(b) “purchaser caused” RECs resulting from new renewable energy projects companies help cause through making a long-term commitment to a price for those resulting RECs.
For companies large enough to procure purchaser caused RECs, unbundled RECs carry reputational risks when presented as helping a company move to 100% renewable energy (since most do not actually “cause” any new renewable energy). All SR Inc Member-Clients with sufficient demand strongly prefer purchaser caused RECs because they are more credible and are now increasing more economically attractive than unbundled RECs. Consequently, SR Inc has long been leading in the Virtual Power Purchase Agreement (VPPA) market and has innovated to help Member-Clients become leaders in buyer aggregated VPPAs (the “VPPA2.0”). The VPPA2.0 enables companies with investment grade credit and an aggregate U.S. & Canada electricity demand of at least ~20,000 MWh to aggregate their procurement to cause new renewable energy at utility scale. This scale drives the most favorable pricing structure and contractual protections risk-averse companies require. All SR Inc Member-Clients who have contracted a VPPA are using the resulting purchaser caused RECs to mitigate their electricity emissions of both their owned and leased real estate in both regulated and deregulated markets in the US.
Whether working with fellow SR Inc Member-Clients in the Net Zero Consortium for Buyers (NZCB) or with independent buyer advisory services, all sophisticated SR Inc Member-Clients are interested in the VPPA market as they chart paths to Net Zero Emissions globally. Every quarter since 2019, SR Inc has therefore been pleased to offer the NZCB VPPA Opportunity Index that enables a comparison of potential wind and solar VPPA performance across U.S. hubs using common analytics. The Index reflects both prior (backcast) performance and forward pricing. The Opportunity Index has been based on proprietary SR Inc analytics and key data sources including those provided by SR Inc partners LevelTen Energy and REsurety.
Key findings from our Q3 analysis include:
- Wind VPPA prices across the country are up 13% on average from the previous 12 months, while solar VPPA prices are up 8%.
- For the past quarter, average realized wind prices in Q3 2021 are up 80% across hubs from Q3 2020 (during Covid) and solar prices are up 49%.
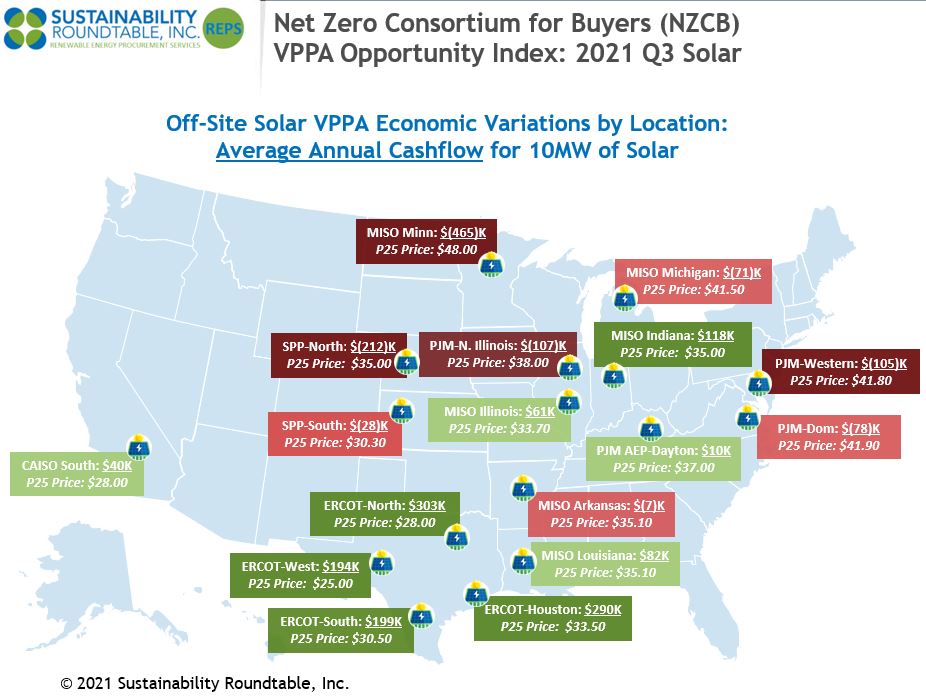
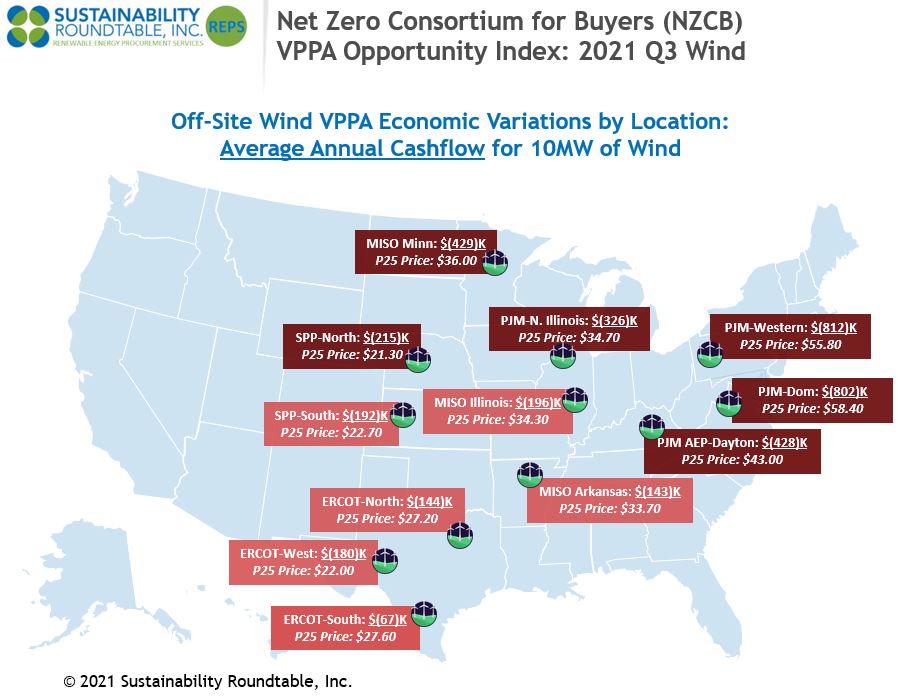
- Due to these dynamics, average expected cashflow through 2035 per 10MW VPPA across hubs was down $90K for wind in Q3 versus Q2 but up $2K for solar.
- Due to the increasing cost of unbundled RECs to nearly $6 on average during Q3, wind VPPAs would have been less expensive in 58% of the hubs versus buying unbundled RECs, and solar VPPAs would have been less expensive in 88% of the hubs.
- The average hub annual cashflow for a 10MW wind VPPA would have been $112K more expensive than buying the equivalent number of unbundled RECs (there were a number of hubs with extreme negative cashflows pulling the average down significantly), and the average hub annual cashflow for a 10MW solar VPPA would have been $142K less expensive than buying the equivalent unbundled RECs.
- ERCOT (Texas) solar presents the most prevalent opportunities for positive cash flow. The average ERCOT annual cashflow for a 10MW solar VPPA was $247K.
- ERCOT also continues to present the best opportunities for wind. However, due to the sharp VPPA price increases in Q3, the average ERCOT annual cashflow for a 10MW wind VPPA was down to $(130)K.
- Solar also presented cash positive opportunities in multiple MISO hubs (IL, IN, and LA) in addition to PJM AEP-Dayton (OH, KY, and PA) and CAISO South (Southern CA).
The NZCB VPPA Opportunity Index is a relatively elementary rendering of complex markets, but NZCB participants find it helpful in beginning to gain an understanding of VPPA market dynamics and financial implications for implementing their renewable energy strategies through aggregated VPPAs. In pursuing any specific VPPA opportunities, NZCB participants require very detailed and custom analytics performed with senior expert assistance before transacting. This assistance requires financial, legal, and market expertise to drive timely procurement strategy development and implementation, transaction structuring, contracting, and negotiation services through a successful and auditable corporate procurement process.
Methodology
- To calculate average annual cashflows, SR Inc multiplies 1) the difference of technology-shaped realized market prices (2015-2020) & forecasted technology-shaped electricity futures market prices (2022-2035) & top quartile VPPA prices in each hub by 2) the typical total annual production for 10MW offtakes for wind and solar, respectively.
- SR Inc uses 36K MWh production per year for 10MW of wind and 26K MWh per year for 10MW of solar to provide “apples to apples” comparisons for both technologies across hubs.
- The top quartile VPPA price assumes a scaled offtake of at least 50MW, but SR Inc uses 10MW because it is typically the minimum individual corporate offtake required within 100+ MW aggregated procurements REPS manages for NZCB participants.
Data Sources
- The NZCB Opportunity Index is developed from proprietary analytics and multiple data providers, which include:
- LevelTen Energy PPA Price Index top quartile VPPA pricing data for Q3 2021 (all proposed projects of 8+ years)
- REsurety REmap actual average, technology-shaped realized market prices for 2015-2020 (excluding the anomaly of February 2021, where wind earned $654/MWh and solar earned $1,260/MWh in ERCOT) and technology-shaped future market price forecasts for 2022-2035 (as of October 19, 2021) based on multiple electricity futures markets.
If you have any additional questions, or would like to learn more about the NZCB, contact info@sustainround.com.
 David Osborn is an accomplished corporate sustainability advisor serving dozens of SR Inc’s Fortune 500 and mid-sized client companies as they drive significant operational efficiencies and better align with talent, customers, investors, and regulators through corporate sustainability strategy. From his career in business consulting and executive leadership, David brings to SR Inc over 20 years of experience in building professional services and technology-driven businesses serving a broad range of client industries. David is a graduate of Dartmouth College and Northwestern’s Kellogg Graduate School of Management. After receiving his MBA, David cut his teeth at Bain & Company in their Boston office and then progressed up to Managing Partner at Booz, Allen & Hamilton (BAH) where he was ultimately elected by his Partners to head their Australasian business. David next returned to the US to head BAH’s Retail Financial Services practice in North America and then transitioned to serve as Managing Partner / EVP at two innovative business service companies at BAH. David then joined SR Inc as Chief Operating Officer in 2010.
 As Director of Research & Consulting at SR Inc, Jeff Meltzer provides outsourced program assistance to clients on a one-to-one basis, helping CSR, operations, and sustainability executives set goals, drive progress, and report the results of their sustainability programs. Jeff holds a Master of Environmental Management from Duke University’s Nicholas School of the Environment and a B.A. in Environmental Policy from Colby College. Before SR Inc, he had relevant work experience with the Procurement and Property Services team at Citizens Bank as an EDF Climate Corps Fellow, with the EHS and Sustainability team at L’Oréal, and with the EPA Green Power Partnership as an Environmental Analyst at Eastern Research Group. He also advised Biogen in helping develop a Scope 3 supplier engagement strategy to achieve its ambitious Science-Based Target. Jeff is also an active participant in sustainability groups, is an accredited LEED Green Associate, is trained in the GRI Standards and GHG Protocol, was the Co-President of the Duke’s Net Impact club, and most recently was a member of the leadership team of Net Impact Boston.