April 23, 2025
Assessing the Impact of the New Administration on U.S. Corporate Renewable Energy Procurement
At SR Inc’s first quarter symposium, held in Boston, Denver, and virtually on March 20th, we shared the Net Zero Consortium for Buyers’ (NZCB)’s preliminary analysis of the impacts of the second Trump Administration on corporate renewable energy procurement in the U.S. Despite a strong outlook for clean energy development under the Biden Administration and increasing corporate participation in the U.S. clean energy market over the last several years, the Trump Administration has taken immediate steps to block climate and clean energy activity. Amidst a litany of anti-climate actions, President Trump’s executive orders targeting renewable energy include blocking new wind farm construction, halting electric vehicle tax credits, and stopping the dispersal of Congressionally approved funds allocated by the Bipartisan Infrastructure Law and Inflation Reduction Act to support solar panel and wind turbine manufacturing.
President Trump’s actions against renewable energy are expected to slow, but not halt, the historic growth of utility-scale renewable energy as U.S. demand for electricity and renewable energy continues to spike and deployed costs for solar and batteries continue to decline year over year. To illustrate this point, the U.S. Energy Information Administration (EIA) recently forecasted a 30% increase (63 GW total) in new utility-scale electric generating capacity to be added to the U.S. power grid in 2025 compared to 2024. These 63 GW of new capacity are expected to be 93% renewable (52% solar, 29% battery storage, and 12% wind) and 7% from natural gas. This is in part because, according to Doyne Farmer’s team at Oxford University, both utility-scale solar and batteries benefit from a learning rate that lowers the cost of their deployment 12% annually.
Since our Symposium, the Trump Administration has announced sweeping tariffs expected to increase the costs on nearly every renewable energy component, which will likely affect PPA prices in future quarters. Most experts also believe wholesale electricity prices will rise over the near and intermediate terms due to advancing demand from AI-driven datacenter load, electrification, manufacturing onshoring, and the move to EVs. This upward demand pressure will likely occur faster than new supply (renewable or fossil fuel) can interconnect and come online, leading to upward price pressure. However, a recession prompted by ongoing tariffs and trade tensions – as many fear – would negatively impact demand growth and mitigate demand increases and related price increases.
Furthermore, as part of budget reconciliation, House Republicans have proposed phasing out tax credits for solar and wind projects. The bill would decrease the production tax credit (PTC) and investment tax credit (ITC) for solar and wind projects by 20% per year for five years starting in the tax year after the act is passed (i.e., 80% for projects started in 2026 down to 0% for projects started in 2030).
Since developers plan and finance utility-scale renewable energy projects multiple years before coming online, the full impact of the tariffs, tax credit changes, and new legislation are not expected to be felt in 2025. For this reason, 2025 may well be the best opportunity for corporations to procure renewables in the U.S. for the next several years. Enterprises hoping to transact should secure third-party transaction management and legal guidance to navigate the complexities of tax credits, tariffs, and the implementation of buyer-favorable risk mitigation measures such as “change in law” provisions and “price adjustor mechanisms” to help manage uncertainty. Companies can also lobby local and federal political leaders to support renewable energy incentives and minimize the effects of harmful federal policies.
Member-Clients can view our full Member Advisory on this topic in our Digital Library.
Q1 NZCB Transaction Activity
In Q1 2025, SR Inc guided and represented over a dozen Member-Clients in aggregated VPPAs through the NZCB. During that time, the NZCB announced its 172MW aggregation with Member-Clients Cisco, Biogen, IDEXX, and Waters for two solar projects in Texas being developed by X-ELIO. With our initial 1 GW goal achieved, the NZCB now focuses on our new bold target: 10 GW of VPPA advanced market commitments (AMCs) for new renewable energy through 2030.
Why Transact with the NZCB?
SR Inc Member-Clients have made the NZCB the leading platform for the aggregated procurement of utility-scale clean energy in the U.S. and now, increasingly, in Europe. Many SR Inc Member-Clients with geographically dispersed electric loads are keenly interested in the impact and scalability of VPPAs. Current GHG accounting rules make this appeal particularly strong in the U.S. / Canada and Europe’s AIB countries, where companies can apply the energy attribute certificates (EACs) to any sites within the respective boundaries.
Despite their appeal, conventional VPPAs are typically out of reach for all but the largest, most geographically concentrated energy users. When most SR Inc Member-Clients aggregate their load across the U.S. / Canada or European AIB countries, they still lack sufficient scale to command the transaction structure, ESG impact terms, and pricing needed to make VPPAs favorable to buyers.
VPPA 2.0: Democratizing Utility-Scale Clean Energy Procurement
Fortunately, SR Inc’s NZCB offers a different approach. With VPPA 2.0, Member-Clients can create economies of scale, experience, and intellect by aggregating their demand. This auditable corporate procurement process, distinguished by its Reverse Auctions, has become core to many SR Inc Member-Client decarbonization strategies. Together, SR Inc Member-Clients are democratizing utility-scale renewable energy procurement, expanding access to clean energy’s environmental and financial benefits beyond the world’s largest energy users to include their value chains and more regularly-sized high-credit enterprises.
VPPA Factors to Monitor
PC EACs for Market Credibility
The growing concern about the reputational risks of unbundled EACs has driven increased pricing for purchaser caused EACs for several years now. (For unfamiliar readers, PC EACs are generated by a project caused by its procurement via a long-term transaction that enabled the project to get financed.) Enterprises demonstrate a willingness to pay for more credible EACs that have unequivocally caused new renewable energy capacity to be built.
Following 2022 and 2023’s steep VPPA price increases, the increases over the past few quarters have been much more modest. The modeled cost of buyer-favorable, VPPA-sourced EACs (i.e., PC EACs) rose $4.42 per EAC on average across wind and solar in all U.S. hubs over the last year as the volume of closed VPPA transactions continues to surge (22GW were closed in 2024, exceeding the former high of 17GW in 2022). While the average modeled U.S. VPPA cost was $11.62 per PC EAC in Q1 2024, it cost $16.04 ($18.53 for solar and $13.55 for wind) in Q1 2025. This overall increase, coupled with the surge in volume of closed deals, reflects the true value of U.S. PC EACs. However, SR Inc procurements achieve significantly better results than that average, thanks to the NZCB’s professionally managed U.S. and European competitions, culminating, as mentioned above, in Reverse Auctions shaped to benefit corporate buyers.
Another factor SR Inc’s NZCB monitors closely is historical and projected earned wind and solar prices across hubs. In Q1 2025, our 22-year earned price indicator decreased 5% for wind and 1% for solar across active VPPA hubs compared to the prior quarter, reflecting lower volatility than prior quarters.
AI Energy Surge
Factors including AI data center proliferation, continued cloud migration, cryptocurrency mining, manufacturing onshoring, electrification (including the migration to EVs), and the adoption of emerging technologies like green hydrogen and battery energy storage drive a surge in power usage. The unprecedented demand for renewables and fossil fuels, as highlighted in the below studies released in Q1 2025, will likely put upward pressure on prices:
- International Energy Agency: Global electricity consumption is expected to grow 4% annually through 2027 due to growing use in industrial production, accelerated electrification, increasing demand for air conditioning, and the expansion of data centers.
- S&P Global Commodity Insights: U.S. electricity demand is projected to grow 35-50% between 2024 and 2040 driven by economic growth, large industrial loads like data centers, and electrification of transport and heating.
- Resources for the Future: According to the 2025 Global Energy Outlook, projected electricity demand will skyrocket through 2050, driven by electrification of end uses, such as transportation, buildings, and data centers.
Electricity price projections expect this demand increase to counter downward price pressure from low natural gas prices and the addition of more renewable energy and storage (with zero marginal costs) to the grid.
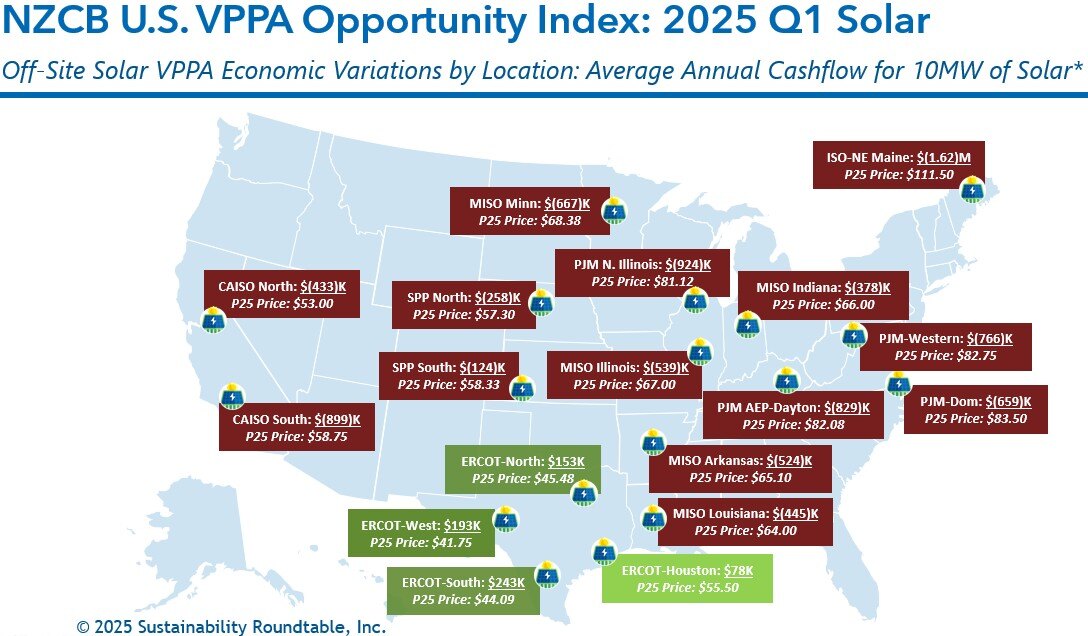
To better quantify U.S. VPPA market dynamics, the NZCB has published the NZCB VPPA Opportunity Index quarterly since 2019 to help advance SR Inc’s mission to accelerate the development and adoption of best practices in more sustainable business. The NZCB VPPA Opportunity Index enables comparison of potential wind and solar VPPA performance across U.S. hubs using common analytics. Based on proprietary SR Inc analytics and data from LevelTen Energy and REsurety, it reflects both prior actual (backcast) performance and carefully modeled forward pricing. Noteworthily, the Index is based upon VPPA offers, not executed transactions, made over the prior quarter.
Key findings from SR Inc’s NZCB Q1 analysis include (which exclude the outlier of Maine solar):
- Top quartile offered wind VPPA prices across the country were down 1% on average from the previous 12 months, while offered solar VPPA prices were up 4%.
- Realized electricity prices have continued to correct down to more historically typical levels. Average trailing 12-month (TTM) realized wind electricity prices in Q1 2025 were down 13% (to $22.31) across active hubs from the TTM in Q1 2024, and realized solar electricity prices were down 29% (to $28.21) from Q1 2024.
- The combination of higher VPPA prices and lower realized prices caused expected cashflows in the TTM for a 10MW wind VPPA to drop $27K from Q1 2024 to Q1 2025 (to negative $973K) and drop $414K (to negative $839K) for a 10MW solar
- Our longer-term view Opportunity Index shows that average modeled cashflow through Q1 2040 per 10MW VPPA across active hubs increased $436K in Q1 (to negative $547K) versus Q4 2024 for wind and decreased $32K (to negative $399K) for solar.
- In Q1, wind VPPAs modeled to be less expensive in 14% of all active hubs versus buying reputationally riskier unbundled EACs (based on the typical average cost today of $3.61 for a 10-year strip of unbundled EACs), and solar VPPAs modeled to be less expensive in 24% of all hubs.
- The average modeled hub annual cashflow for a 10MW wind VPPA would have been $417K more expensive than buying the equivalent number of reputationally riskier multi-year unbundled EAC strips, and the average modeled hub annual cashflow for a 10MW solar VPPA would have been $312K more
- Price modeling shows that ERCOT solar presented modeled opportunities for better-than-breakeven cashflow in Q1. The average modeled ERCOT annual cashflow for a 10MW solar VPPA was $167K.
- For wind, price modeling continued to show that ERCOT South presented the best modeled opportunity in Q1, which was negative $16K per 10MW VPPA.
- To underscore the importance of NZCB’s procurement process, 2025 Q1 NZCB procurements for PC EACs from to-be-built solar were at or below the Q1 P25 VPPA prices for the same hubs, despite also providing more than a dozen specially sought and secured buyer-favorable risk management terms required by risk-averse, environmentally motivated corporate procurement teams.
The NZCB VPPA Opportunity Index intentionally simplifies complex markets. Nevertheless, many NZCB participants find the rendering helps them begin to understand the market dynamics and financial implications of VPPA-based renewable energy strategies.
When NZCB participants wish to pursue specific VPPA opportunities, SR Inc offers stakeholder briefings and detailed, customized analytics before transacting. This bespoke financial, legal, and market expertise helps VPPA offtakers to develop a timely procurement strategy; implement the procurement strategy in an auditable way; and structure, contract, and negotiate the transaction in a buyer-favorable manner. SR Inc supports NZCB buyers throughout the corporate procurement process, helping them to navigate rapidly changing markets such as the one we are in today.

*Methodology
- To calculate average annual cashflows, SR Inc multiplies 1) the difference of technology-shaped realized market prices (2018-2025) and forecasted technology-shaped electricity futures market prices (2025-2040) versus top quartile VPPA prices in each hub by 2) the typical total annual production for 10MW offtakes for wind and solar, respectively.
- SR Inc uses 36K MWh production per year for 10MW of wind and 24K MWh per year for 10MW of solar to provide “apples-to-apples” comparisons for both technologies across hubs.
- The top quartile VPPA price assumes a scaled offtake of at least 50MW, but SR Inc uses 10MW because it is typically the minimum individual corporate offtake required within 100+ MW aggregated procurements for NZCB participants.
Data Sources
- The NZCB Opportunity Index is developed from proprietary analytics and multiple data providers, which include:
- LevelTen Energy PPA Price Index North America top quartile VPPA pricing data for Q1 2025 (all proposed projects of 8+ years)
- REsurety CleanSight Discover actual average, technology-shaped realized market prices for Q2 2018-Q1 2025 and technology-shaped future market price forecasts for Q2 2025-Q1 2040 (as of April 18, 2025) based on multiple electricity futures markets.
If you have additional questions or would like to learn more about the NZCB, please contact info@sustainround.com.