November 6, 2025
Executive Summary
Highlights and Recommendations
The table below summarizes the current renewable energy market in the United States as of Q3 2025:
|
Theme |
Key Data / Insight |
Risk |
|---|---|---|
|
PPA Prices |
In Q3 2025 virtual power purchase agreement (VPPA) prices have continued to rise: Wind is up 9% and Solar up 6%. |
Continued price increases will make achieving decarbonization and clean energy goals more expensive with each passing quarter. |
|
Electricity Demand Surge |
AI data centers, electrification, and manufacturing are driving unprecedented demand (e.g., ERCOT peak demand is projected to increase ~60% by 2030). |
Competition for available clean energy capacity will continue to intensify, threatening the ability to secure projects needed to meet decarbonization targets. |
|
Tax Credit and Regulatory Changes |
The primary clean energy tax credits will expire for projects that don’t “begin construction” by mid-2026 or reach the end-of-2027 in-service deadline. Foreign Entity of Concern (FEOC) compliance deadline beginning in 2026 will add new costs and complexity for many developers. |
Projects that are verified as FEOC-free and tax-credit-qualified will become increasingly scarce, with higher prices and more seller-favorable terms and conditions. |
Most corporate buyers with plans to transact – and Member Clients who have been following SR Inc guidance to pursue portfolio diversification – are accelerating their offtake planning to take advantage of current proposals before potential price increases and more seller-favorable terms become market, which is highly likely to occur due to tariffs, material costs, tax credit expiration, and growing electricity demand.
Introduction
The U.S. renewable energy market is tightening as structural cost pressures, policy milestones, and credit phaseouts converge. In Q3 2025, average VPPA offer prices rose across major ISOs, reflecting higher capital expenditures, supply chain constraints, and uncertainty surrounding the beginning of 2026 Foreign Entity of Concern (FEOC) compliance guidelines. Concurrently, projects that have (1) safe-harbored federal Investment Tax Credits and/or Production Tax Credits or (2) positioned for commercial operation before 2028 maintain a material pricing advantage. As greenhouse gas accounting frameworks evolve, particularly with ongoing Greenhouse Gas Protocol (GHGP) and Science Based Target Initiatives (SBTi) revisions, buyers face growing scrutiny around the credibility and impact of their renewable procurement strategies.
SR Inc’s Net Zero Consortium for Buyers (NZCB) Q3 2025 U.S. VPPA Opportunity Index analysis highlights the key market, policy, and standard-setting developments driving VPPA economics and identifies actionable opportunities for corporate buyers to mitigate risk and capture long-term value.
This quarter’s Opportunity Index includes six sections:
- Key Insights from SR Inc's Q3 2025 Opportunity Index
- Rising PPA Prices
- Investment and Production Tax Credits
- Evolving Standards and GHGP Guidance
- Electricity Market Trends and Insights
- Analysis of the Q3 2025 VPPA Market
- SR Inc’s Guidance for Current or Interested NZCB Clients
- Q3 2025 Quantitative Analysis
- Appendix
- NZCB Background
- Acronyms Glossary
Key Insights
Rising PPA Prices
The third quarter of 2025 marked a clear inflection point: VPPA prices demonstrated an upward trend, largely driven by escalating development costs and demand at yet again record pace so far in 2025. Interestingly, Q3’s VPPA price increases were primarily driven by tariffs on steel, aluminium, copper, and other essential materials – pushing up prices for developers and the Engineering, Procurement, and Construction (EPC) firms with whom they partner.
At the same time, the safe harboring of federal clean energy tax credits and pending updates to greenhouse gas accounting standards are reshaping project economics and accelerating corporate decarbonization strategies. As we have seen regularly in the past when the tax credits would expire every two years, the opportunity to secure cost favorable VPPA will decrease over time as we approach the 30-50% subsidy phase out, creating time pressure for NZCB participants with VPPAs as part of their U.S. decarbonization and energy strategy to mitigate downside risk and unfavorable contractual terms.
Tax Credit Bridge
The expiration of clean energy tax credits represents a “cliff” for U.S. wind and solar assets, but projects that successfully safe harbor credits using the 5%-spend approach (off-site included) or have a pre-2028 commercial operation date (COD) have a “bridge” for traversing this cliff. The beginning-of-2026 FEOC compliance deadline is a key inflection point after which additional costs for projects with substantial foreign materials or foreign investments from entities deemed “FEOC” will likely be priced in. Buyers who can find FEOC-free, tax-credit-qualified projects looking for offtake are strongly encouraged to pursue such opportunities as they will become increasingly scarce in late 2026 and early 2027.
Evolving Standards & GHGP Guidance
Revisions to the GHGP and SBTi frameworks are introducing new complexity to corporate decarbonization strategies. The most important points to remember are (1) the current GHGP proposal is a first proposed discussion draft, with the second proposed discussion draft expected in 2026, (2) GHGP is planning on moving to potential adoption in 2027 with implementation applying as late as 2030 or even 2035, and (3) as a corporation, you have the power to create change in the guidelines.
Currently, the GHGP is conducting a 60-day public consultation on the Scope 2 Standard that will run until Dec 19, 2025. SBTi just launched their second 30-day public consultation on the CNZS V2.0, which will close on Dec 8, 2025. These public consultations are critical components of standard development procedures where stakeholders are able to contribute feedback on any topics related to newly proposed guidance.
GHGP Guidance
In the most recent version of GHGP’s proposal, GHGP is exploring the enforcement of a 24/7 approach to quality criteria for market-based instruments, including hourly matching, rather than the current annual matching standard, and tighter geographical requirements than current RE100-aligned market boundaries. SR Inc believes this is a misguided effort to create stronger criteria for EACs. The higher-impact standard (represented in GHGP’s other open consultation on consequential accounting), still remains one of causation: long-term, bundled contracts such as VPPAs that enable new clean energy projects to be built.
Consequential accounting appropriately valorizes the leadership embedded in the causation of new renewable electricity and GHGP needs to see all the available evidence to this effect. SR Inc encourages all Member-Clients who have contributed to causing new renewable energy through their procurement to prepare details of these transactions to submit to GHGP, both in the context of establishing a strong legacy clause to protect these prior transactions – which we are confident will be implemented – and in the effort of reframing the necessity of this approach.
There is universal insistence among corporates for a robust Legacy Clause if consequential change is effected. A grandfathering or legacy clause within evolving standards is expected to preserve the validity of existing long-term renewable energy contracts. This provision would ensure that projects initiated under current frameworks – such as VPPAs that demonstrably add new renewable capacity – remain credible and countable toward future emissions reduction targets. If you are able to contribute in any aspect to the GHGP’s Scope 2 consultation, we recommend focusing your effort on submitting details on your VPPAs and helping to shape the structure of this legacy clause as such clauses will be essential for maintaining the viability and integrity of today’s high impact decarbonization investments as standards continue to evolve.
For additional perspective, see SR Inc Founder and CEO Jim Boyle’s commentary here.
Electricity Market Trends and Insights
Q3 2025 Renewable Energy Adoption and Electricity Price Trends
WoodMac and SEIA’s joint quarterly report showed that solar, wind, and storage accounted for 82% of new capacity in H1 2025 (56% from solar, 10% from wind, and 16% from storage). Texas remained the top state for solar capacity. The utility-scale solar segment installed 5.7 GW in Q2 2025, compared to 9 GW from last quarter, decreasing 28% YoY and 33% QoQ. It has been slowed by less deployment in Texas and uncertainty from the Budget Reconciliation Bill as final rules were made in Q3 2025. The industry has yet to feel the full impacts of these federal actions.
The U.S. wind market installed 593 MW (down 60% compared to Q2 2024). Despite the Q2 slowdown, activity is projected to pick up, with 51% forecasted capacity expected to come online in Q4, rounding the estimated annual 2025 total to 7.7 GW. WoodMac and ACP projects the post-OBBBA U.S. onshore wind market will increase 3.6% (2.4 GW) QoQ as developers focus on bringing projects to commercial operation prior to the tax credit expiration deadline.
Supply chain and manufacturing capacity grew by 4.3 GW in Q2, but with no additions of upstream manufacturing capacity (polysilicon, wafer, or cell manufacturing), similar to in Q1. A more in-depth overview of supply chain, manufacturing, and the levelized cost of technologies can be found in SR Inc’s Q2 2025 Opportunity Index under “Recent Solar and Wind Trends and Analysis.”
WoodMac and ACP report the utility-scale energy storage segment set a record of 4.9 GW installed in Q2, enough capacity to power 3.7 million American homes during average peak demand. The storage pipeline remains strong amidst an evolving policy environment, with predictions of reaching 88 GW by 2029 from 17 GW in 2024 despite policy headwinds potentially resulting in a 10% drop in installations in 2027. This expected storage increase is a critical tool for creating more load flexibility and therefore maintaining grid reliability and affordability.
Electricity Demand Outlook
AI-focused data-center buildout is pushing the demand for power to new heights. Many of the big tech players are signing PPAs to cover this new demand at a rapid speed, putting time pressure on other potential buyers. Continued cloud migration, cryptocurrency mining, manufacturing onshoring, electrification (including the migration to EVs), and battery energy storage are also driving a surge in power usage. The unprecedented demand for renewables and fossil fuels, as highlighted in the below studies released in Q2 2025-Q3 2025, will likely put upward pressure on prices:
ERCOT-specific:
- ERCOT (Texas grid operator)’s own study shows a summer peak demand increase of ~60% from 2025-2030, and non-peak demand to increase by 40% by 2030.
Data-center specific:
- Bloomberg New Energy Finance (BNEF) forecasted U.S. data center power demand will more than double by 2035, rising from almost 35 GW in 2024 to 78 GW. Actual energy consumption growth from data centers will be even steeper, with average hourly electricity demand nearly tripling.
- The World Resources Institute found that estimates for data center loads are in the range of 5-13% of total electricity demand by 2030.
- The same BNEF study found that four companies – Amazon Web Services (AWS), Google, Meta, and Microsoft – are in control of 42% of U.S. data-center capacity. AWS alone has plans to quadruple its 3 GW capacity to nearly 12 GW in the coming years, indicating substantial influence over regional infrastructure. Regionally, PJM remains the largest U.S. data-center market through 2035, followed by ERCOT and the Southeast.
Across the U.S.:
- The Bank of America Institute forecasted U.S. electrical demand growth at 2.5% CAGR between 2024-2035. This is a stark increase from the 0.5% CAGR between 2014-2024.
- The Energy Information Administration (EIA)’s Short Term Energy Outlook July forecast shows nationwide U.S. retail electricity sales to ultimate customers growing at an annual rate of 2.2% in both 2025 and 2026.
- ICF’s analysis shows that U.S. electricity demand is expected to grow 25% by 2030 and 78% by 2050. For energy customers – residential and commercial – electricity rates could increase 15% to 40% by 2030 depending on the market.
Electricity price forecasts indicate that growing demand is offsetting some of the downward pressure typically associated with increased renewable generation and storage capacity. However, persistently elevated natural gas prices continue to constrain broader price relief. The rapid expansion of AI infrastructure represents a structural shift in U.S. electricity demand, exerting sustained upward pressure on prices and capacity requirements. To meet this evolving demand while maintaining grid reliability, there is a strategic imperative to accelerate renewable generation and storage investments. Such expansion will not only diversify the energy mix and reduce exposure to fuel price volatility but also align long-term system growth with decarbonization and resilience objectives.
Analysis of the Q3 2025 VPPA Market
VPPA Wind and Solar Pricing trends:
In Q3 2025, SR Inc’s analysis found that top quartile offered wind VPPA prices across the country were up 9% on average from the previous 12 months, while offered solar VPPA prices were up 6%.
What’s affecting VPPA prices?
The Budget Reconciliation Bill has spurred major shifts in U.S. clean energy development. As outlined in SR Inc’s Q2 2025 U.S. Opportunity Index, the utility-scale clean energy sector is facing a new economic reality: projects with commercial online dates before 2028 are more valuable than ever. Q3’s PPA price increases were primarily driven by tariffs on steel, aluminium, copper, and other essential materials – pushing up prices for developers and the Engineering, Procurement, and Construction (EPC) firms they partner with.
In the near term, these tariffs – on top of country-specific tariffs – are applying upward pressure on project costs. A recent Commerce Department Anti-Dumping/Countervailing Duties (AD/CVD) investigation into solar component manufacturers in Laos, India, and Indonesia could further elevate costs. Pending FEOC rules will add compliance challenges and potentially limit tax credit eligibility for projects using components from prohibited entities, adding increased development complexity and risk.
Following the July 4 signing of the Budget Reconciliation Bill and the subsequent Treasury guidance on tax credit qualification in August (as covered in our Q2 Index), U.S. developers have been racing to begin construction on as many projects as possible before July 4, 2026 to qualify for the full tax credits. These often appear in the form of signing binding contracts for main power transformers. This strategy helps developers safe harbor projects and secure Inflation Reduction Act (IRA)-era tax credits.
SR Inc’s Guidance for Current or Interested NZCB Clients
What should SR Inc’s Clients interested in causing new clean energy projects do?
Clients seeking to catalyze new clean energy projects should act quickly. Developers are accelerating efforts to qualify projects for IRA-era tax incentives; however, the available eligible capacity is finite. (V)PPA prices are expected to continue rising beyond current levels, and contract terms will likely become more seller-favorable as project availability tightens.
The NZCB’s Project Selection Criteria & Risk-Management
The NZCB prioritizes projects with a pre-2028 COD and projects that are reaching the beginning of construction milestones. NZCB offtakers also target well-resourced developers experienced in bringing projects to completion.
Recent federal actions have altered the permitting landscape, particularly for wind projects. The Interior Department now requires more extensive reviews for developments on public lands or private lands needing federal approval. To avoid such delays, the NZCB is prioritizing projects that are not subject to federal authority as the authority having jurisdiction.
Developers have grown accustomed to assessing project viability in light of the many changes – from the Budget Reconciliation Bill to shifting tariff regimes and forthcoming FEOC rules. SR Inc’s NZCB evaluates projects using a five-tier risk framework encompassing (1) Market Conditions, (2) Developer Strength, (3) Project Readiness, (4) Legal Terms, and (5) Financial Viability.
Purchaser-Caused Environmental Attribute Credits (EACs) for Market Credibility
The growing concern about the reputational risks of unbundled EACs has driven increased pricing for purchaser caused EACs for several years now. (For readers unfamiliar with “PC EACs,” they are generated by a project caused by the procurement of those EACs via a long-term transaction that served as the proximate cause of the project’s financing).
The modeled cost of buyer-favorable, VPPA-sourced EACs (i.e., PC EACs) stayed fairly consistent on average across wind and solar in all U.S. hubs over the last year as the volume of closed VPPA transactions continues to surge (22GW were closed in 2024 and 18GW were closed in 2025 through Q3, both exceeding the former high of 17GW in 2022). While the average modeled U.S. VPPA cost was $16.41 per PC EAC in Q3 2024, it cost $16.78 ($18.64 for solar and $14.93 for wind) in Q3 2025. These costs reflect the true value of U.S. PC EACs. However, SR Inc procurements achieve significantly better results than that average, thanks to the NZCB’s professionally managed U.S. and European competitions, culminating in disciplined Reverse Auctions shaped to benefit corporate buyers.
Another factor SR Inc’s NZCB monitors closely is historical and projected earned wind and solar prices across hubs. In Q3 2025, our 22-year earned price indicator increased 7% for wind and increased 2% for solar across active VPPA hubs compared to the prior quarter.
Quantitative Analysis
To better quantify U.S. VPPA market dynamics, the NZCB has published the NZCB VPPA Opportunity Index quarterly since 2019 to help advance SR Inc’s mission to accelerate the development and adoption of best practices in more sustainable business. The NZCB VPPA Opportunity Index enables comparison of potential wind and solar VPPA performance across U.S. hubs using common analytics. Based on proprietary SR Inc analytics and data from LevelTen Energy and REsurety, it reflects both prior actual (backcast) performance and carefully modeled forward pricing. Noteworthily, the Index is based upon VPPA offers, not executed transactions, made over the prior quarter.
Key findings from SR Inc’s NZCB Q3 analysis include:
- Top quartile offered wind VPPA prices across the country were up 9% on average from the previous 12 months, while offered solar VPPA prices were up 6%.
- Realized electricity prices have remained low but increased from the prior year. Average trailing 12-month (TTM) realized wind electricity prices in Q3 2025 were up 22% (to $23.53) across active hubs from the TTM in Q3 2024 and realized solar electricity prices were up 22% (to $34.26) from Q3 2024.
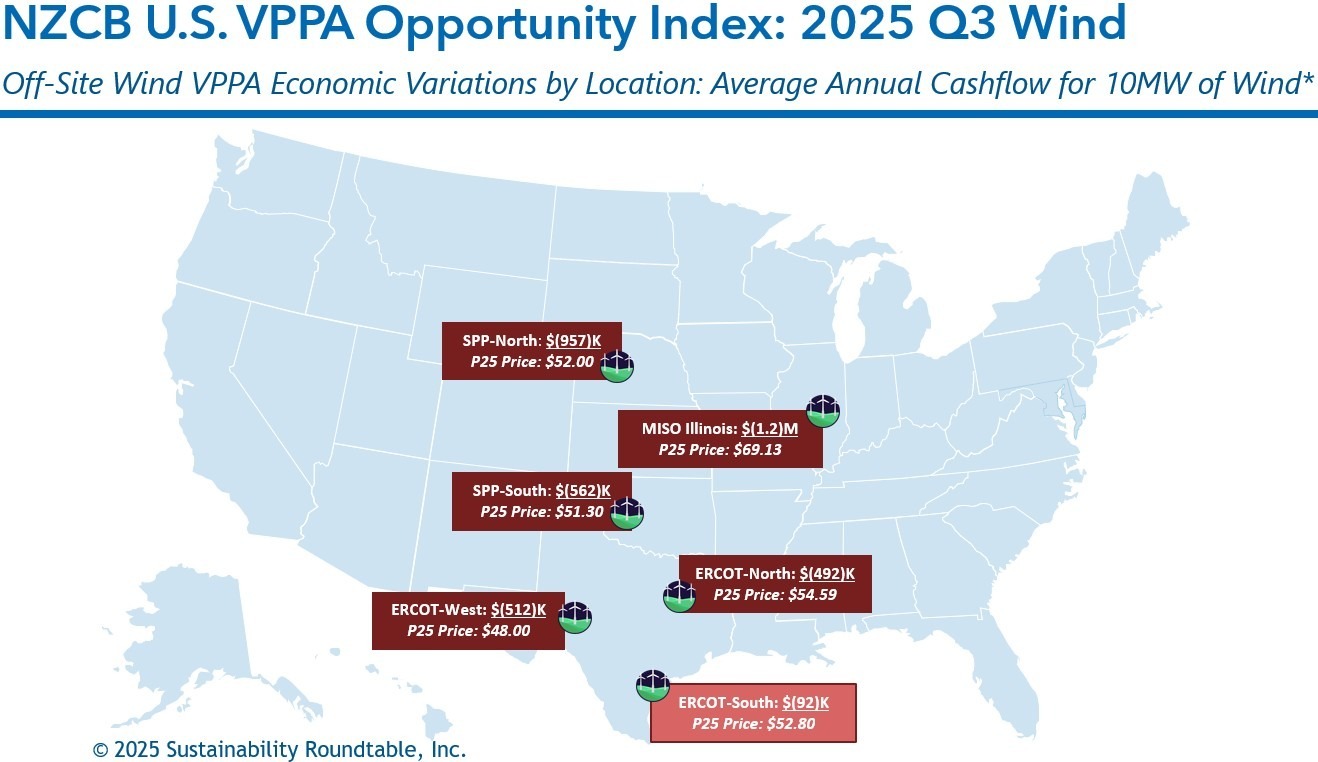
- The combination of VPPA prices and realized prices caused expected cashflows in the TTM for a 10MW wind VPPA to drop $43K from Q3 2024 to Q3 2025 (to negative $1.1M) and increase $44K (to negative $791K) for a 10MW solar VPPA.
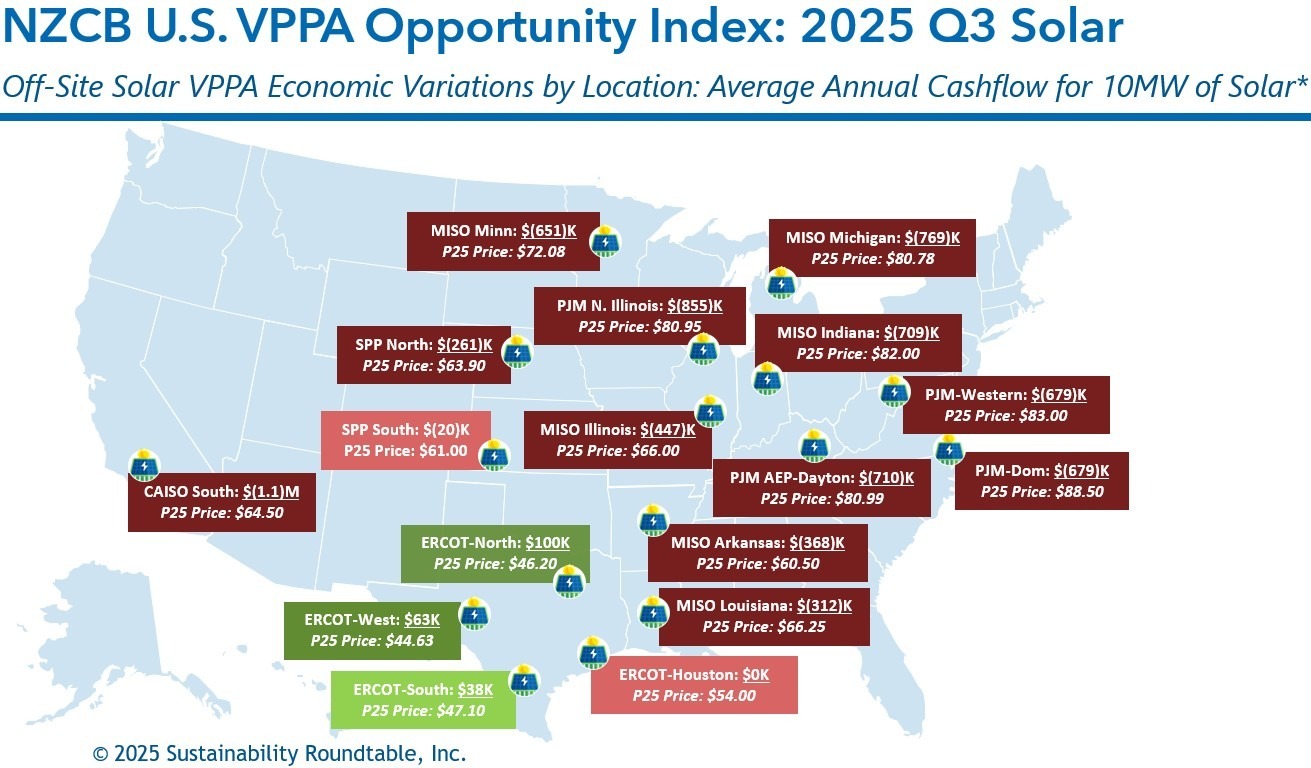
- Our longer-term view Opportunity Index shows that average modeled cashflow through Q3 2040 per 10MW VPPA across active hubs increased $64K in Q3 (to negative $631K) versus Q2 2024 for wind and decreased $68K (to negative $435K) for solar.
- In Q3, wind VPPAs modeled to be less expensive in 17% of all active hubs versus buying reputationally riskier unbundled EACs (based on the typical average cost today of $3.41 for a 10-year strip of unbundled EACs), and solar VPPAs modeled to be less expensive in 29% of all hubs.
- The average modeled hub annual cashflow for a 10MW wind VPPA would have been $509K more expensive than buying the equivalent number of reputationally riskier multi-year unbundled EAC strips, and the average modeled hub annual cashflow for a 10MW solar VPPA would have been $353K more expensive.
- Price modeling shows that ERCOT solar presented modeled opportunities for better-than-breakeven cashflow in Q3. The average modeled ERCOT annual cashflow for a 10MW solar VPPA was $50K.
- For wind, price modeling continued to show that ERCOT South presented the best modeled opportunity in Q3, which was negative $92K per 10MW VPPA.
- To underscore the importance of NZCB’s procurement process, 2025 Q3 NZCB procurements for PC EACs from to-be-built solar were below the Q3 P25 VPPA prices for the same hubs, despite also providing more than a dozen specially sought and secured buyer-favorable risk management terms required by risk-averse, environmentally motivated corporate procurement teams.
The NZCB VPPA Opportunity Index intentionally simplifies complex markets. Nevertheless, many NZCB participants find the rendering helps them begin to understand the market dynamics and financial implications of VPPA-based renewable energy strategies.
When NZCB participants wish to pursue specific VPPA opportunities, SR Inc offers stakeholder briefings and detailed, customized analytics before transacting. This bespoke financial, legal, and market expertise helps VPPA offtakers to develop a timely procurement strategy; implement the procurement strategy in an auditable way; and structure, contract, and negotiate the transaction in a buyer-favorable manner. SR Inc supports NZCB buyers throughout the corporate procurement process, helping them navigate rapidly changing markets such as the one we are in today.
*Methodology
- To calculate average annual cashflows, SR Inc multiplies 1) the difference of technology-shaped realized market prices (2018-2025) and forecasted technology-shaped electricity futures market prices (2025-2040) versus top quartile VPPA prices in each hub by 2) the typical total annual production for 10MW offtakes for wind and solar, respectively.
- SR Inc uses 36K MWh production per year for 10MW of wind and 24K MWh per year for 10MW of solar to provide “apples-to-apples” comparisons for both technologies across hubs.
- The top quartile VPPA price assumes a scaled offtake of at least 50MW, but SR Inc uses 10MW because it is typically the minimum individual corporate offtake required within 100+ MW aggregated procurements for NZCB participants.
Data Sources
- The NZCB Opportunity Index is developed from proprietary analytics and multiple data providers, which include:
- LevelTen Energy PPA Price Index North America top quartile VPPA pricing data for Q3 2025 (all proposed projects of 8+ years)
- REsurety CleanSight Discover actual average, technology-shaped realized market prices for Q4 2018-Q3 2025 and technology-shaped future market price forecasts for Q4 2025-Q3 2040 (as of October 20, 2025) based on multiple electricity futures markets.
Appendix
Appendix A: NZCB Background
Q3 NZCB Transaction Activity
In Q3 2025, SR Inc guided and represented more than dozen Member-Clients in aggregated VPPAs through the NZCB. We were happy to announce an aggregated solar VPPA procurement in Italy with four Member-Clients including Synopsys, Autodesk, and IDEXX. With our initial 1 GW goal achieved, the NZCB now focuses on our new bold target: 10 GW of VPPA advanced market commitments (AMCs) for new renewable energy through 2030.
Why Participate in the NZCB?
SR Inc Member-Clients have made the NZCB the leading platform for the aggregated procurement of utility-scale clean energy in the U.S. and now, increasingly, in Europe. Many SR Inc Member-Clients with geographically dispersed electric loads are keenly interested in the impact and scalability of VPPAs. Despite their appeal, conventional VPPAs are typically out of reach for all but the largest, most geographically concentrated energy users. When most SR Inc Member-Clients aggregate their load across the U.S. / Canada or European AIB countries, they still lack sufficient scale to command the transaction structure, ESG impact terms, and pricing needed to make VPPAs favorable to buyers.
VPPA 2.0: Democratizing Utility-Scale Clean Energy Procurement
With VPPA 2.0, Member-Clients can create economies of scale, experience, and intellect by aggregating their demand. This auditable corporate procurement process, distinguished by its Reverse Auctions, has become core to many SR Inc Member-Client decarbonization strategies. Together, SR Inc Member-Clients are democratizing utility-scale renewable energy procurement, expanding access to clean energy’s environmental and financial benefits beyond the world’s largest energy users to include their value chains and more regularly sized high-credit enterprises.
If you have additional questions or would like to learn more about the NZCB, please contact info@sustainround.com
Appendix B: Acronym Glossary
|
Acronym |
Definition |
|
ACP |
American Clean Power Association – The national trade group representing the U.S. wind, solar, transmission, and storage industries. |
|
AD/CVD |
Anti-Dumping / Countervailing Duties – Trade enforcement measures applied to imported goods sold below fair market value or subsidized by foreign governments, often affecting renewable component costs. |
|
AIB |
Association of Issuing Bodies – The European organization that standardizes Energy Attribute Certificates (EACs) through the European Energy Certificate System (EECS). |
|
CNZS |
Corporate Net-Zero Standard – The Science Based Targets initiative (SBTi) framework defining credible corporate “net-zero” targets. |
|
COD |
Commercial Operation Date – The date when a renewable energy project becomes operational and begins generating electricity under its contract. |
|
EAC |
Energy Attribute Certificate – A certificate verifying that one megawatt-hour of electricity was generated from renewable sources (includes U.S. RECs and European GOs). |
|
EPC |
Engineering, Procurement, and Construction – A contracting model where one firm designs, procures, and builds the project. |
|
ERCOT |
Electric Reliability Council of Texas – The independent system operator managing most of the Texas electric grid and wholesale electricity market. |
|
FEOC |
Foreign Entity of Concern – A U.S. regulatory designation restricting clean energy tax benefits for projects using materials or financing from certain foreign entities. |
|
GHGP |
Greenhouse Gas Protocol – The global framework for measuring and reporting greenhouse gas emissions, maintained by WRI and WBCSD. |
|
IRA |
Inflation Reduction Act – 2022 U.S. legislation providing long-term tax credits and incentives for clean energy investment and manufacturing. |
|
ITC / PTC |
Investment Tax Credit / Production Tax Credit – Federal incentives that reduce project costs (ITC) or reward energy generation over time (PTC). |
|
NZCB |
Net Zero Consortium for Buyers – SR Inc.’s collaborative platform that enables corporate members to jointly procure renewable energy through aggregated VPPAs. |
|
OBBBA |
One Big Beautiful Bill Act – A U.S. federal statute passed on July 4th 2025 containing tax and spending reconciliation efforts. |
|
PC EAC |
Purchaser-Caused Energy Attribute Certificate – An EAC tied to a renewable project that was financed or built because of a buyer’s long-term procurement (e.g., VPPA). |
|
RE100 |
Renewable Electricity 100% Initiative – A global initiative uniting companies committed to sourcing 100% renewable electricity. |
|
SBTi |
Science Based Targets Initiative – A global partnership that validates corporate emissions reduction targets aligned with climate science. |
|
VPPA |
Virtual Power Purchase Agreement – A financial agreement for renewable electricity that delivers environmental benefits and price certainty without physical power delivery. |