February 19, 2026
Executive Summary
|
Theme |
Key Insight |
Risk/Recommendation |
|
Rising Costs and Risk Premiums for VPPAs |
Tariffs, Foreign Entity of Concern (FEOC) guidance, interconnection congestion, labor and engineering, procurement, and construction (EPC) cost inflation, insurance costs, and permitting uncertainty have increased both price levels and price dispersion, contributing to rising renewable and electricity price forecasts. |
Q4 2025 – like Q3 2025 – saw increasing PPA prices and decreasing supply, emphasizing the time-sensitive moment for corporations wishing to secure VPPAs to reach their sustainability goals. Experienced VPPA buyers are continuing to transact, particularly big tech companies. Q4 data shows that VPPA prices rose across most markets. As in the past, best modeled opportunities in Q4 2025 were concentrated in ERCOT solar, with opportunities for breakeven or better cashflow. |
|
Policy Reversals Accelerate Near-Term Activity |
Policy changes have created a near-term rush to qualify clean energy projects for remaining tax credit windows – driving a short-term surge in contracting activity and intensifying competition for late-stage, financeable projects (EPA). |
In 2026, corporations face a shrinking opportunity to secure tax-credit-supported U.S. VPPAs at attractive pricing. |
|
Increasing Electricity Demand and the Coal Rebound |
After two years of declines, U.S. greenhouse gas emissions increased in 2025, driven in part by rapid electricity demand growth and increased coal generation. Per the EIA, generation fueled by coal increased by 13% in 2025 (EIA). |
Saw rising forecasted and realized electricity prices in Q4 2025. Data centers supporting AI were a major demand catalyst, alongside cold-weather impacts on heating use. |
|
Solar Remains the Backbone of New-Build Generation |
Solar led U.S. new-build in 2025: EIA reports 22.2 GW of actual utility-scale solar capacity additions year-to-date through November 2025, far exceeding wind’s 4.2 GW over the same period (EIA). |
Solar (and other renewable energy sources) continued to be the leading source of new electricity generation growth, serving as a critical counterweight to fossil fuel generation increases as load growth accelerated. |
2026 U.S. VPPA Market Outlook: Key Factors and Strategic Signals
Tightening supply, policy uncertainty, and structural load growth are reshaping pricing dynamics and transaction strategy in 2026. The following themes represent the primary market signals corporate buyers should continue to monitor in the new year:
- Near-Term Power Price Increases
- Wholesale electricity prices are expected to rise due to load growth and cold weather patterns
- Elevated VPPA Pricing
- VPPA prices will likely remain elevated. While some ISOs saw price stabilization or declines from Q3 2025 to Q4 2025 (LevelTen), structural cost pressures persist
- Reduced Full Tax Credit-Eligible Project Supply
- Fewer projects may qualify for full federal tax credits as compliance requirements tighten, constraining optimized PPA project availability
- Greater Scope 2 & 24/7 Clarity
- Further guidance on Greenhouse Gas Protocol’s (GHGP) legacy clause and 24/7 hourly matching is expected to emerge
- Clean Firm Resources Growth
- Clean firm technologies (nuclear, geothermal, hydropower, fusion) are gaining traction, representing 17% of announced corporate procurement capacity in 2025 compared to 83% for traditional clean projects from solar, wind, and battery storage (CEBA)
- Storage Becoming More Standard for Solar PPAs
- Battery storage will continue to be a critical component for capacity accreditation, delivery firming, and regulatory compliance, particularly as evolving regulations may require data centers to disconnect from the grid during peak hours for grid flexibility
Electricity Market Trends and Insights
Q4 2025 marked a continued structural shift in the U.S. VPPA market: offer prices increased while late-stage, financeable supply tightened. As a result, 2026 represents a narrowing window for buyers seeking tax-credit-supported projects with buyer-favorable terms. At the same time, wholesale electricity prices are projected to move higher across multiple regions, reflecting accelerating load growth and upward revisions to demand forecasts. Understanding prevailing market dynamics is essential to evaluating pricing trends and their implications for new-build renewable energy projects underpinning VPPAs.
Power Demand Growth
The U.S. is consuming more electricity now than at any other period in its history, ending more than two decades of sub-1% annual load growth. Driven by data centers and AI compute, manufacturing, and electrification, nationwide electricity demand is expected to increase by approximately 16% in the next five years (Grid Strategies).
The three primary load-growth regions through 2029 are:
- ERCOT – data centers & oil and gas production
- PJM – data centers in Northern Virginia and Pennsylvania; manufacturing in Ohio
- Georgia Power – data centers in the Atlanta area and manufacturing
In 2025 alone, electricity demand increased by 2.4% nationwide, with the largest growth in Texas, the Mid-Atlantic, and Ohio-Valley (New York Times).
BloombergNEF’s December 2025 outlook projects data center electricity demand reaching 106 GW by 2035 – a 37% upward revision from its prior forecasts issued just seven months earlier (BloombergNEF). Given renewables’ relatively low levelized cost of energy (LCOE), high scalability, and short development timelines, wind and solar are critical to meeting this demand growth.
Wholesale Price Formation & Forward Outlook
Fuel Markets & Marginal Pricing
Natural gas remains the marginal fuel in most U.S. wholesale power markets. In 2025, U.S. natural gas prices rebounded from prior lows due to elevated LNG exports and weather-driven heating demand. Higher gas prices translated directly into elevated wholesale electricity prices. Higher wholesale power prices relative to fuel costs improved generator margins and increased coal dispatch in certain regions, reinforcing upward pressure on clearing prices across ISOs.
Retail electricity rates have already risen in several regions, including PJM (namely in New Jersey, Virginia, etc.). In response, many utilities are advancing new gas-fired generation projects (Canary Media). These additions are capital-intensive and may contribute to higher consumer costs over time. Furthermore, short-term weather volatility – including severe winter conditions this winter – further amplifies natural gas and electricity price spikes. As extreme weather events increase in frequency and intensity, weather-driven demand shocks are likely to remain a structural contributor to price volatility.
Long-Term Price Expectations
Global electricity demand is projected to grow 3.6% per year on average through 2030, with incremental generation from renewables, natural gas, and nuclear required to meet load growth (IEA Electricity 2026 Report). To maintain reliability and integrate new supply, annual grid investment will need to rise by about 50% by 2030 to meet the growing electricity demand. The interaction among demand growth, generation buildout, and transmission expansion is driving ongoing shifts in forward power pricing.
Forward curves and independent long-term forecasts indicate rising wholesale electricity prices over the 10-20 year horizon. NZCB uses 10-15 independent forecasts in VPPA cash flow modeling. SR Inc’s NZCB monitors closely historical and projected earned wind and solar prices across hubs. In Q4 2025, our 22-year earned price indicator increased 6% for wind and 2% for solar across active VPPA hubs compared to the prior quarter.
At the same time, post-tax credit policy changes have weakened medium- and long-term renewable buildout outlooks, particularly for solar and wind. While natural gas generation is expected to expand it may not fully offset slowing renewable deployment amid accelerating demand. The resulting imbalance increases the likelihood of tighter capacity margins (discrepancy between supply and demand) and elevated wholesale pricing during peak periods, exacerbated by ever-changing weather patterns such as the recent winter storm Fern (EIA).
In this environment, VPPAs often function as a natural hedge against electricity expenditure volatility. When wholesale prices rise, higher VPPA settlements typically help offset higher physical electricity costs. Conversely, when power prices decline, corporate electricity spend decreases help offset lower VPPA settlements. This correlation can help neutralize the electricity spend risk that companies face today without potentially expensive direct hedging transactions.
Electricity Generation Trends
Globally, renewables and nuclear are forecast to generate 50% of electricity by 2030, up from 42% today (IEA). Natural gas generation is also expected to expand to meet rising electricity demand, while coal generation globally trends downward toward 2021 levels.
In contrast, the U.S. burned approximately 13% more coal in 2025 relative to 2024. As a result, U.S. GHG emissions rose by 2.4% in 2025 after 2 years of decline (Rhodium Group). Federal policy actions – including directives from the Energy Department to extend operations at eight coal-burning units beyond their planned closure dates – have slowed planned retirements (New York Times). Policy actions extending the operations of certain coal-fired units and colder winter temperatures contributed to this reversal.
Absent a 34% increase in solar generation in 2025, emissions would likely have been materially higher (Rhodium Group). Solar and other non-emitting generation remains essential to moderating emissions trajectories amid rising demand.
In 2025, solar and wind accounted for around 90% of new U.S. electricity capacity, with solar remaining the dominant new-build source. According to FERC data, solar and wind now comprise nearly one-quarter of total installed U.S. utility-scale generating capacity (solar: 11.42%; wind: 11.81%).
Solar is projected to remain the leading source of new generation through at least July 2028. While federal policy changes – including provisions in the Budget Reconciliation legislation such as the Foreign Entity of Concern (FEOC) rules and import tariffs – could influence renewable energy deployment, experienced developers have extended project pipelines through 2029 under established “beginning of construction” guidelines (Baker Donelson). Future deployment levels remain subject to evolving federal and state policy frameworks.
Collectively, sustained demand growth, constrained transmission expansion, evolving policy frameworks, and fuel price volatility are contributing to generally upward trending long-term electricity price outlooks across some U.S. markets.
VPPA Deal Structure & Economics
Q4 2025 Supply & Demand Trends
Using data from NZCB’s latest U.S. RFPs and NZCB’s data partners, Q4 2025 saw corporate VPPA renewable energy projects become more scarce. Developers are backing out of their proposals as we see the effects of tax credit changes and tariffs come into full swing now versus prior U.S. RFPs. Big offtakers – mostly large tech companies – are grabbing projects where they can. Developers are withdrawing projects due to pricing and interconnection concerns and an increasingly difficult environment for financing projects.
These factors support the conclusion that if your corporation is considering a VPPA transaction in the near-term, the time to act is now. With electricity prices predicted to rise and the low supply of renewable energy projects saved from tax credit cuts in high demand from corporate buyers, NZCB participants considering a VPPA transaction in the U.S. are acting sooner than later.
SR Inc NZCB’s Risk Management & Mitigation
The NZCB Five Level Risk Ranking scores hundreds of proposals from our RFPs across five categories: Market Conditions, Developer Strength, Project Readiness, Legal Terms, and Financials. This structured framework enables the NZCB to advise buyers and navigate evolving policy conditions with discipline and confidence.
Risk management remains central to NZCB’s recommendations. The NZCB continues to prioritize projects offering full hub settlement without basis-risk sharing, scoring them more favorably within our Five-Level Risk Ranking, particularly in regions with historically low basis volatility. Where change-in-law (CiL) provisions are unavoidable, SR Inc advocates for clearly defined price-adjustment mechanisms to prevent unmitigated cost pass-through. In the current policy and tariff environment, the NZCB strongly encourages buyers to engage sophisticated transaction management and legal counsel to navigate tax credit eligibility, tariff exposure, and the implementation of these buyer-favorable protections.
The NZCB also emphasizes contract structures that balance downside protection with upside opportunity. Many NZCB buyers are pursuing upside-sharing mechanisms – first pioneered by SR Inc in 2017 and widely used in Europe – to mitigate rising PPA prices while preserving value from favorable market settlements. Under this structure, the fixed PPA price is lowered and positive settlement value is shared between the corporate buyer and the developer.
Additionally, the NZCB is also increasingly evaluating hybrid projects, including battery storage-enabled configurations, to enhance peak-period flexibility and mitigate curtailment risk. Collectively, these approaches position aggregated VPPAs as a disciplined, risk-managed strategy for corporations to secure clean power capacity in volatile markets.
Guidance for Corporations Looking to Procure Renewable Energy
Accelerate procurements to preserve tax credit value
Many NZCB participants are accelerating their procurement timelines to secure projects eligible for current federal tax incentives. While diversification across developers, technologies, and pricing hubs remains a prudent risk-management strategy, buyers with more limited demand in early 2026 are increasingly consolidating volume into fewer, larger transactions to secure capacity ahead of potential tax credit step-downs or expirations.
Engage advisors to aid your holistic procurement strategies
As a buy-side-only advisor, SR Inc structures procurements to reflect buyer priorities rather than developer-driven terms. Reverse auction RFPs premised on the buyer favorable NZCB Letter of Intent (LOI) and Term Sheet (TS) enable buyer-favorable transaction designs unique to the NZCB, including conservative settlement structures, enhanced downside protections, and tailored risk allocation. This portfolio mindset allows buyers to diversify across projects, geographies, and contract terms, reducing exposure to congestion, pricing volatility, and development uncertainty.
Closely monitor Scope 2 GHGP and SBTi framework revisions
Ongoing updates to the Greenhouse Gas Protocol (GHGP) and the Science Based Targets initiative (SBTi) are also influencing some companies’ procurement timing. Many organizations are executing VPPAs under existing accounting frameworks with the expectation that robust legacy provisions will preserve eligibility under future Scope 2 guidance. Long term renewable energy contracts – such as VPPAs – signed under the existing frameworks are broadly expected to retain recognition over their contractual terms.
Prioritize causation and project maturity
Projects that demonstrate clear causation – such as VPPAs supporting new renewable capacity – provide the strongest environmental claims. The NZCB favors projects with secured interconnection agreements and advanced permitting to mitigate development and queue risk, particularly in light of accelerating load growth across major U.S. ISOs.
Prepare for 24/7 matching and grid-integrated solutions
Corporations investigating hourly or 24/7 clean energy matching are evaluating storage-enabled or hybrid procurement pathways and considering technology diversification. Although the market in the U.S. for hybrid VPPA projects has not fully developed, the NZCB is closely monitoring VPPA storage pathways. SR Inc is also actively working with Member-Clients on developing 24/7 in-grid strategies and solutions. Please reach out to your SR Inc Service Team to learn more.
Maintain focus on decarbonization solutions
Amid renewable energy industry changes which occurred in 2025, corporates should remain anchored to long-term decarbonization objectives. Purchaser caused energy attribute certificates (PC EACs) remain among the highest-impact form of scope 2 decarbonization your company can take to reach sustainability goals. (For readers unfamiliar with “PC EACs,” they are generated by a project caused by the procurement of those EACs via a long-term transaction that served as the proximate cause of the project’s financing). The ever-evolving dynamics of the electricity market makes expertly selected and negotiated VPPA projects an attractive way of procuring EACs for your organization.
Why VPPAs?
PC EACs for Market Credibility
The growing concern about the reputational risks of unbundled EACs has driven increased pricing for PC EACs for several years now.
The modeled cost of buyer-favorable, VPPA-sourced EACs (i.e., PC EACs) stayed fairly consistent on average across wind and solar in all U.S. hubs over the last year as the volume of closed VPPA transactions continues to surge (an annual record of 24.5 GW were closed in 2025 through November, exceeding the former high of 21.7 GW in 2024). While the average modeled U.S. VPPA cost was $20.12 per PC EAC in Q4 2024, it cost $19.24 ($18.57 for solar and $19.90 for wind) in Q4 2025.
These costs reflect the true value of U.S. PC EACs. However, SR Inc procurements achieve significantly better results than that average, thanks to the NZCB’s professionally managed U.S. and European competitions, culminating in disciplined Reverse Auctions shaped to benefit corporate buyers.
Quantitative Analysis
To better quantify U.S. VPPA market dynamics, the NZCB has published the NZCB VPPA Opportunity Index quarterly since 2019 to help advance SR Inc’s mission to accelerate the development and adoption of best practices in more sustainable business. The NZCB VPPA Opportunity Index enables comparison of potential wind and solar VPPA performance across U.S. hubs using common analytics. Based on proprietary SR Inc analytics and data from LevelTen Energy and REsurety, it reflects both prior actual (backcast) performance and carefully modeled forward pricing. Noteworthily, the Index is based upon VPPA offers (which NZCB participants view as “marketing prices”), not executed transactions (which include multiple buyer-favorable protections), made over the prior quarter.
Key findings from SR Inc’s NZCB Q4 analysis include:
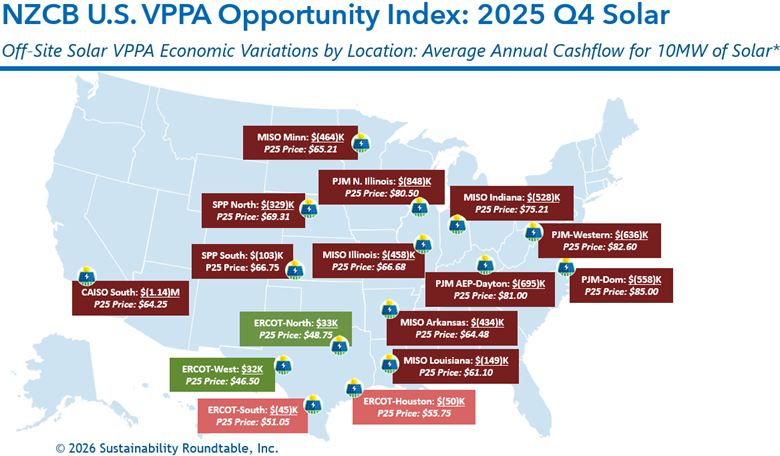
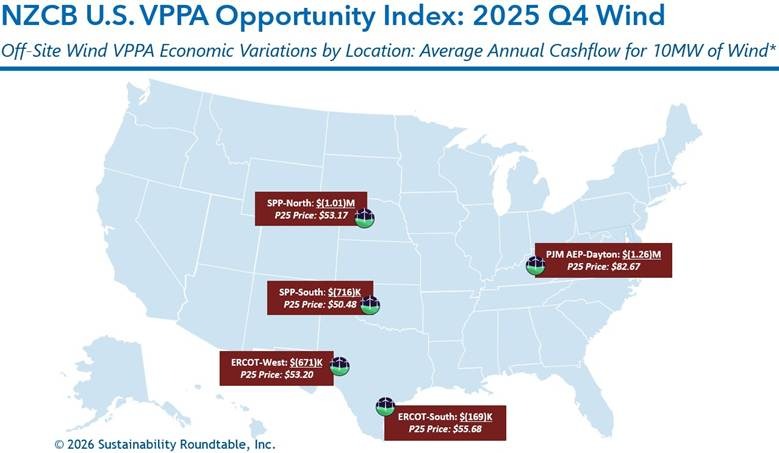
Q4 2025 takeaway: Higher VPPA offer prices + higher realized hub prices translated into mostly negative modeled economics across the U.S. as a whole, with limited bright spots in ERCOT and in NZCB procurements that beat benchmarks on price and terms.
- Top quartile offered wind VPPA prices across the country were up 11% on average from the previous 12 months, while offered solar VPPA prices were up 4%.
- Realized electricity prices have remained low but increased from the prior year. Average trailing 12-month (TTM) realized wind electricity prices in Q4 2025 were up 27% (to $26.26) across active hubs from the TTM in Q4 2024 and realized solar electricity prices were also up 27% (to $34.96) from Q4 2024.
- The combination of higher VPPA prices and higher realized prices caused expected cashflows in the TTM for a 10MW wind VPPA to drop $16K from Q4 2024 to Q4 2025 (to negative $1.2M) and increase $82K (to negative $753K) for a 10MW solar VPPA.
- Our longer-term view Opportunity Index shows that average modeled cashflow through Q4 2040 per 10MW VPPA across active hubs decreased $134K in Q4 (to negative $765K) versus Q3 2024 for wind and increased $37K (to negative $398K) for solar.
- In Q4, wind VPPAs modeled to be less expensive in none of active hubs versus buying reputationally riskier unbundled EACs (based on the typical average cost today of $3.16 for a 10-year strip of unbundled EACs as of January 2026), and solar VPPAs modeled to be less expensive in 25% of all hubs.
- The average modeled hub annual cashflow for a 10MW wind VPPA would have been $652K more expensive than buying the equivalent number of reputationally riskier multi-year unbundled EAC strips, and the average modeled hub annual cashflow for a 10MW solar VPPA would have been $322K more expensive.
- Price modeling shows that ERCOT solar presented the best modeled opportunities for breakeven cashflow in Q4. The average modeled annual cashflow for a 10MW ERCOT solar VPPA was negative $8K.
- For wind, price modeling continued to show that ERCOT South presented the best modeled opportunity in Q4, which was negative $169K per 10MW VPPA.
- To underscore the importance of NZCB’s procurement process, active 2025 Q4 NZCB procurements for PC EACs from to-be-built solar were below the Q4 P25 VPPA prices for the same hubs, despite also providing more than a dozen specially sought and secured buyer-favorable risk management terms required by risk-averse, environmentally motivated corporate procurement teams.
The NZCB VPPA Opportunity Index intentionally simplifies complex markets. Nevertheless, many NZCB participants find the rendering helps them begin to understand the market dynamics and financial implications of VPPA-based renewable energy strategies.
When NZCB participants wish to pursue specific VPPA opportunities, SR Inc offers stakeholder briefings and detailed, customized analytics before transacting. This bespoke financial, legal, and market expertise helps VPPA offtakers to develop a timely procurement strategy; implement the procurement strategy in an auditable way; and structure, contract, and negotiate the transaction in a buyer-favorable manner. SR Inc supports NZCB buyers throughout the corporate procurement process, helping them navigate rapidly changing markets such as the one we are in today.
Methodology
- To calculate average annual cashflows, SR Inc multiplies 1) the difference of technology-shaped realized market prices (2018-2025) and forecasted technology-shaped electricity futures market prices (2025-2040) versus top quartile VPPA prices in each hub by 2) the typical total annual production for 10MW offtakes for wind and solar, respectively.
- SR Inc uses 36K MWh production per year for 10MW of wind and 24K MWh per year for 10MW of solar to provide “apples-to-apples” comparisons for both technologies across hubs.
- The top quartile VPPA price assumes a scaled offtake of at least 50MW, but SR Inc uses 10MW because it is typically the minimum individual corporate offtake required within 100+ MW aggregated procurements for NZCB participants.
Data Sources
- The NZCB Opportunity Index is developed from proprietary analytics and multiple data providers, which include:
- LevelTen Energy PPA Price Index North America top quartile VPPA pricing data for Q4 2025 (all proposed projects of 8+ years)
- REsurety CleanSight Discover actual average, technology-shaped realized market prices for Q1 2019-Q4 2025 and technology-shaped future market price forecasts for Q1 2026-Q4 2040 (as of January 22, 2026) based on multiple electricity futures markets.
For our Q1 2026 Index, we plan to publish the full version only to SR Inc Member-Clients and NZCB participants. If you have additional questions or would like to learn more about joining the NZCB, please contact info@sustainround.com