
May 26, 2026
Executive Summary
- Market Conditions – The blockade of the Strait of Hormuz and attacks on Qatari LNG infrastructure have driven Dutch gas futures to €45.6/MWh, the highest since March 2022, while Norway's historic hydropower shortfall has created a 25 TWh deficit, reducing electricity exports to Germany and the UK.
- VPPA Pricing Trends – Solar VPPA prices fell 3% quarter-over-quarter to €57.57/MWh and wind fell 1% to €49.95/MWh. Wind continues to offer materially better settlement value, with a projected settlement value of ~€15/MWh versus ~€0/MWh for solar.
- VPPA Opportunities – Portugal and Finland offer the strongest wind VPPA economics, generating modeled positive cash flows of €319K and €34K per 10 MW offtake, respectively. For solar, Spain leads with an estimated €83K positive cash flow per 10 MW.
- Emerging Technologies – Hybrid solar-plus-storage and wind-plus-solar projects are gaining buyer interest as they mitigate cannibalization and price volatility; France's redesigned CfD structure now actively favors co-located battery configurations.
- Regulatory Tailwinds – The EU's Industrial Accelerator Act, Affordable Energy Action Plan, and North Sea Offshore Wind Pact collectively improve permitting, grid access, and PPA market liquidity, though EU-origin equipment requirements may place upward pressure on future VPPA strike prices.
Introduction
The SR Inc Net Zero Consortium for Buyers (NZCB) European Virtual Power Purchase Agreement (VPPA) Opportunity Index informs corporate renewable energy buyers interested in procuring clean energy in Europe. It provides an overview of VPPA trends, key regulatory changes, battery energy storage system (BESS) trends, and solar and wind forward pricing by active country.
European energy markets are entering 2026 under a confluence of pressures that have materially sharpened the strategic case for long-term clean energy offtake agreements. The blockade of the Strait of Hormuz, a critical transit route for roughly one-fifth of the world's oil and liquid natural gas (LNG), amid US and Israeli strikes on Iran, has rattled energy markets and caused significant price volatility. Attacks on LNG infrastructure in countries such as Qatar constrains European supply, especially in countries like Italy, Belgium, and Poland which are particularly vulnerable to these Qatari LNG import risks. This caused a spike in the price of natural gas (Pexapark subscription required) with the Dutch gas futures 2027 contract peaking at €45.6/MWh, the highest since March 2022.
Simultaneously, a supply-side shock is reverberating through Europe's clean energy system itself. Norway, known as "Europe's biggest battery" for its massive hydropower system, is facing a significant shortfall after a dry, snowless winter left snow reserves at their lowest level in two decades, creating a deficit of 25 terawatt-hours, equivalent to roughly a fifth of the country's total 2025 hydropower output, forcing reductions in electricity exports to Germany and the UK.
Together, these dynamics of fossil fuel import vulnerability, LNG supply disruption, and weakened dispatchable renewable output, are converging into a powerful structural argument for corporate buyers to lock in price certainty through VPPAs. Companies are increasingly signing renewable PPAs and VPPAs to reduce their exposure to volatile energy markets, with analysts drawing direct parallels to the post-Ukraine structural shift that drove a durable move away from fossil fuel dependency, a trajectory that the current crisis appears poised to accelerate further.
PPA Trends
In Q1 2026, LevelTen Energy reported that there was a growing divergence between the realized value of solar and wind assets, with wind having an increasingly larger projected settlement value (PSV) at around €15/MWh (e.g. each GO would save offtakers €15) than solar which remains at around €0/MWh (e.g. no savings or cost per GO). LevelTen found that the market-averaged P25 (lowest quartile) PPA pricing was down for both solar and wind in Q1. LevelTen and SR Inc analysis shows Q1 2026 solar PPA prices were down 3% from Q4 2025 and wind prices were down 1%. Market-averaged prices allow each country to be equally weighted even if there is a lower proportion of projects in the pool from some.
While standalone assets have been impacted by cannibalization and record-breaking curtailment, hybrid assets appear to be at an advantage with the ability to shift generation away from peak production hours when prices are low to low production hours when prices are high. This phenomenon is especially pronounced for solar plus storage hybrid projects.
Wind offers were only proposed in Finland and Portugal on the LevelTen platform which limits the range of data gathered, although Q1 PPA transaction data points towards more favorable wind bids and more demand from buyers for wind projects over solar ones.
LevelTen has also shown an uptick in buyer interest in wind plus solar projects, which are often proposed by wind developers who have small co-located solar assets, and tend to lean towards more wind capacity than solar. Buyers can often find better value in these projects because of their ability to mitigate against cannibalization and price volatility through profile diversification.
Offtakers are not only looking towards new technologies for their PPAs, but also for new contract structures. For example, in Spain, Pexapark reports that due to technical and economic curtailment, corporate offtakers are looking to transact in fixed-volume PPAs and favor projects with co-located BESS signaling changing characteristics to the European corporate offtake.
BESS Updates
German BESS Projections
Germany's BESS market saw substantial growth in 2025 and is poised for even faster expansion in 2026. New BESS additions from assets above 1 MW totaled around 1,494 MWh over the course of 2025, accounting for more than one third of Germany's total installed BESS capacity, which stood at 3.73 GWh at year-end. For context, total solar production in Germany was about 71,000,000 MWh in Germany While this growth trajectory is significant, the fleet's annualized throughput of roughly 545 GWh represents only about 1.5% of Germany's total solar production, underscoring that even a tripling of installed capacity in 2026 would address only a modest share of the negative pricing hours increasingly driven by solar oversupply.
However, on a year-on-year basis, added energy capacity nearly doubled, representing a 93% increase in GWh terms. Looking ahead, the trajectory appears even steeper: planned new installed capacity for 2026 amounts to 2.3 GW and 4.9 GWh, which would imply a growth rate of more than 200%.
Deal activity has also matured alongside physical deployment. In 2025, total announced offtake capacity exceeded 1 GW across 25 deals, and contract structures have evolved, with tolling agreements rising from two of eleven deals in 2024 to seven of twenty-five deals in 2025, reflecting the growing need for stable revenue structures to support debt financing. The majority of the other deals were merchant revenue sharing structures which offer less price certainty to the developer. The reliance on tolling agreements can signal commodity price volatility and more selective capital. They also help the developer through long term offtake agreements, as a market is being built out.
However, grid connection constraints continue to weigh on project economics, as many assets are currently approved only as green storage (defined as thermal energy storage, hydrogen energy storage, and BESS) and are not yet permitted to charge from the grid due to connection constraints, representing a key challenge the sector will need to navigate as deployment accelerates.
France: CfD Redesign Favors Co-located PV + BESS
France's energy regulator (CRE) is redesigning the subsidy contracts for difference (CfDs) that underpin large-scale solar development. Under the current framework, developers receive a guaranteed "strike price," with the government topping up the difference when market prices fall short. The proposed reform shifts the price benchmark used to calculate those payments from a solar-weighted average to a broader market average, and partially removes compensation during negative-price hours. Together, these changes reduce estimated government subsidy exposure by around a third, but expose standalone solar developers to both price and volume risk for the first time.
The reform was deliberately calibrated around co-located solar and battery (hybrid) projects. Under the new rules, batteries can absorb power during negative-price hours without triggering a loss of CfD support, and energy discharged outside those hours qualifies for subsidy payments which effectively allows developers to monetize the price spread within the subsidy structure.
This alignment between the new settlement benchmark and what hybrid assets can realistically achieve makes their revenue more predictable to lenders, improving bankability. Strike prices are expected to rise modestly, by around €10/MWh, to reflect the greater risk now borne by generators.
For standalone solar, the changes structurally increase financing costs and earnings volatility, as the new benchmark no longer softens the disadvantage of generating heavily during low-price midday hours. For hybrid developers, the reform creates a more favorable and stable revenue pathway. Importantly, existing contracts are unaffected as the new rules apply only to future auction rounds, with a phased experimental rollout before full implementation. The direction of travel is clear: France is using its CfD structure to actively steer new capacity toward storage-integrated configurations.
Regulatory Updates
Industrial Accelerator Act
In March 2026, the European Commission formally proposed the Industrial Accelerator Act (IAA), aimed at strengthening the EU's industrial resilience, competitiveness, economic security, and strategic autonomy while working to decarbonize industry. It does this by pushing forward European Union-origin or “made in EU” products in strategic sectors.
The EU's manufacturing sector accounts for 14.3% of total GDP, down from 17.4% in 2000, and the IAA sets an ambition to reverse that trend and reach 20% by 2035. It is also responsible for about 15% of total EU emissions. Energy-intensive industries have especially suffered reductions in production volumes as the cost gap between Europe and other parts of the world have widened. Approximately €500 billion in investment is needed by 2040 for the chemicals, pulp and paper, basic metals, and non-metallic minerals industries to decarbonize.
Steel, cement, and aluminum producers must demonstrate low-carbon content to access public procurement contracts and support schemes, with compliance verified through established carbon-intensity frameworks including the EU Emissions Trading System and the Carbon Border Adjustment Mechanism. This creates a direct commercial incentive for energy-intensive producers to lock in clean energy credentials through clean energy procurements, since the ability to prove low-carbon status is now tied to market access.
Member States must designate at least one Industrial Manufacturing Acceleration Area within 12 months of the IAA's entry into force, backed by aggregated baseline permits covering common authorizations so that project promoters only need to obtain additional permits for activities falling outside that baseline. For renewable developers and corporate offtakers structuring VPPAs, these Areas represent a meaningful siting signal: co-located industrial load and mandated grid planning may reduce basis risk relative to more congested parts of the network, while the permitting streamlining lowers development friction.
Cost is a counterweight of this regulation since European Union-origin requirements for solar, wind, batteries, and other clean technologies rise over time, with wind component requirements increasing from one to two main specific components after three years, and since European-manufactured equipment currently carries a cost premium over Chinese alternatives, developers procuring compliant components will face higher capital expenditure that is likely to flow through into the VPPA strike prices they require to make projects financeable.
The IAA therefore cuts VPPA markets in two directions simultaneously: improving the demand-side environment by clustering industrial load and creating compliance-driven incentives for clean energy procurement, while placing upward pressure on the supply side through equipment localization requirements — with the net outcome depending largely on how quickly European clean technology manufacturing scales and whether the cost premium narrows fast enough to offset the siting advantages the zones are designed to create.
Affordable Energy Action Plan and Grid Investment
As part of the Clean Industrial Deal, which is the European Union’s cornerstone strategy to reach net zero by 2050 by focusing on energy intensive industries and the clean tech sector, the European Commission unveiled its Affordable Energy Action Plan in February 2025, structured around four pillars: lowering energy costs for all, completing the Energy Union, attracting investment and ensuring delivery, and being ready for potential energy crises.
A central focus of the plan is expanding access to corporate PPAs, and to do so the European Investment Bank and the Commission launched a €500 million pilot program in 2025 to support PPA counter-guarantees. In April 2026, the Commission published a recommendation on removing barriers to PPA development, covering access for small buyers, guarantees and other risk-reduction measures, accounting rules, guarantees of origin, and extending coverage to purchase agreements for energy carriers beyond electricity, including heat, biogas, and hydrogen.
The Commission also committed to issuing detailed guidance to Member States on combining CfDs with PPAs, and to introducing new rules to develop European forward markets, expanding hedging options and further stabilising prices — with fully delivering a flexible clean electricity system potentially lowering average EU wholesale electricity prices by 40%.
On grid infrastructure, the Commission adopted a Grids Package in December 2025 to strengthen EU energy infrastructure, issuing guidance on efficient and timely grid connections and on anticipatory grid investments to ensure grids are ready to accommodate the needs of industry, businesses, households, and clean energy.
The Grids Package also formalized the Energy Highways initiative, a set of strategic interconnection projects designed to remove bottlenecks. It also introduced a proposed Permitting Acceleration Directive with binding EU-level time limits for permitting procedures, responding to the fact that even projects designated as Projects of Common Interest frequently take five or more years to secure permits. Together, these energy-side measures are designed to complement the Industrial Accelerator Act by ensuring that EU industry has access to affordable, stable, and clean power as it undertakes the capital-intensive decarbonization the IAA demands.
For corporate VPPA offtakers, the IAA creates both tailwinds and headwinds. On the positive side, the requirement that Member States conduct comprehensive analysis of energy needs within Industrial Manufacturing Acceleration Areas and ensure that network development plans reflect those needs should, over time, reduce basis risk in these areas thereby increasing realized prices for corporate offtaker VPPAs. The IAA's streamlined single-access permitting also benefits offtakers by compressing development timelines and reducing the period of exposure between contract execution and project commissioning, which is one of the more material sources of delivery risk in long-term VPPA structures. On the negative side, EU-origin requirements may increase development costs and the financeable floor price found in government auctions.
Finally, companies will increasingly need to demonstrate both the origin and carbon intensity of their products, with supply-chain traceability, emissions accounting, and documentation becoming essential eligibility requirements, meaning that for offtakers using VPPAs to substantiate low-carbon credentials under the IAA's procurement framework, guarantees of origin alone may no longer be sufficient.
North Sea Offshore Wind Pact
The Hamburg Declaration introduces a set of structural dynamics with meaningful implications for VPPA pricing and market risk across the North Sea region. The commitment to approximately 5 GW of annual offshore wind deployment between 2031 and 2040, underpinned by ten-country political coordination, points toward a sustained expansion of generation supply: a factor that could exert downward pressure on merchant power prices and, by extension, widen VPPA settlement volatility for corporate offtakers holding floating-price contracts.
At the same time, the pact's emphasis on hybrid offshore assets connected to multiple national grids via subsea interconnectors introduces a layer of basis risk complexity, as cross-border price convergence remains uneven and contingent on grid buildout timelines that are far from guaranteed. On the financing side, the absence of a unified cross-border funding mechanism means that project economics will continue to rely on national auction schemes and bilateral PPA structures, keeping strike price dynamics fragmented across jurisdictions rather than converging toward a regional benchmark. However, the anticipated mobilization of up to €1 trillion in offshore wind investment through 2040 is likely to sustain strong developer competition, which historically supports more favorable pricing tension for VPPA offtakers. For risk-averse corporate buyers, the key watchpoints remain permitting delays, supply chain bottlenecks in turbines and subsea cables, and the pace of marine spatial planning harmonization – each of which could constrain new capacity additions and tighten the supply-demand balance in ways that push power curves higher than current forward markets reflect.
By reinforcing CfDs and PPAs as the preferred revenue instruments — and building on established frameworks like the North Seas Energy Cooperation, the EU Wind Power Package, and the Ostend Declaration — the declaration signals continued governmental alignment with market-based contracting mechanisms. The emphasis on cross-border grid integration and hybrid offshore assets further expands the addressable geography for VPPA structuring, as interconnected markets reduce basis risk and broaden the pool of eligible generation assets.
SR Inc’s Q1 2026 Financial Evaluation
The NZCB found that solar VPPA offer prices (on a like-for-like basis) had decreased from €59.28 in Q4 to €57.57 across active countries in Q1 (3% decrease), likely due to increased negative prices and solar cannibalization. While there were four countries with active solar offers in Q1, there were only two with active wind offers, and the average wind VPPA price (on a like-for-like basis) decreased from €50.56 in Q4 to €49.95 across active countries in Q1 (1% decrease).
Using both historical and forecasted data in Q1 2026, SR Inc’s analysis shows that average VPPA settlement prices across active hubs was €50.02/MWh through term for solar and €55.83/MWh for wind (ranging from €36.15/MWh for Spanish solar to €65.78 for Portugal wind).
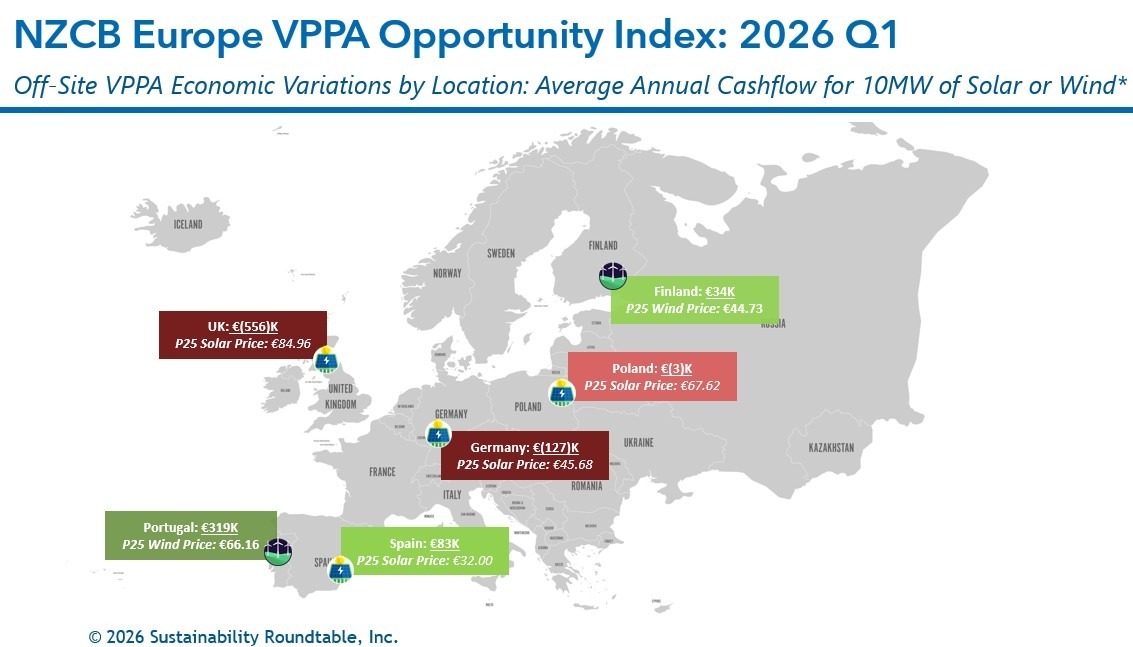
As represented in the graphic below, our analysis shows that Poland and Spain showed the greatest opportunities for positive or breakeven cashflow for solar VPPAs in Q1 2026, earning an average annual positive cashflow of €(3)K and €83K, respectively for a 10 MW offtake. However, the average estimated return on a 10 MW solar offtake across the active European countries was a loss of about €151K per 10MW in Q1, which equates to a cost of about €7.54/GO, which is more expensive than buying reputationally riskier unbundled GOs, which cost €1.48 each for a 10-year strip as of April 2026.
The below graphic shows that the greatest modeled opportunities for positive cashflow for wind VPPAs in Q1 2026 were Portugal and Finland, producing average positive cash flows of €319K and €34K, respectively, for a modeled 10 MW offtake. As both these markets produce a savings per GO, they compare favorably to buying reputationally risky unbundled GOs.
Methodology
- To calculate average annual cashflows, SR Inc multiplies 1) the difference of historical backcast data and forecasted technology-shaped electricity futures market prices versus top quartile VPPA prices in each hub by 2) the typical total annual production for 10MW offtakes for wind and solar, respectively.
- SR Inc uses 30K MWh production per year for 10MW of wind in Europe and 20K MWh per year for 10MW of solar in Europe to provide “apples-to-apples” comparisons for both technologies across hubs.
- The top quartile VPPA price typically assumes a scaled offtake of at least 30MW, but SR Inc uses 10MW because it is a typical minimum individual corporate offtake required within aggregated procurements for NZCB participants.
- Our solar analysis is based on LevelTen P25 data from Germany, Poland, Spain, and the United Kingdom.
- Wind analysis includes LevelTen P25 data on Finland and Portugal.
Data Sources
- The NZCB Opportunity Index is developed from proprietary analytics and multiple data providers, which include:
- Top Quartile VPPA Pricing data: LevelTen Energy PPA Price Index Europe
- Historical Data:
- Pexapark Pexaquote for technology-specific historical capture factors (as of April 21, 2026).
- ENTSO-E Transparency Platform (Dataset 12.1.D) for day-ahead baseload prices by European bidding zone (as of April 21, 2026).
- Forecasted Data:
- LevelTen Energy PPA MarketPulse for three base technology-shaped “base” future market price forecasts for 2027-2041 (as of April 27, 2026).
- Pexapark Pexaquote technology and market-specific 15-year price curves (as of April 17, 2026).
About the NZCB
The Net Zero Consortium for Buyers (NZCB) is a buy-side-only procurement consortium operated by SR Inc, designed to give corporate buyers access to utility-scale renewable energy procurement on terms previously available only to large utilities and hyperscale technology companies. NZCB members benefit from aggregated purchasing scale, SR Inc’s reverse auction structure (which consistently produces below-market pricing), and SR Inc’s buy-side-only advisory model, ensuring that every recommendation reflects the interests of corporate buyers.
Through NZCB, companies with 10 MW or more of individual offtake capacity in a given market can participate in transactions that deliver premium pricing, project quality, and contractual protections. SR Inc’s VPPA 2.0 model democratizes access to this procurement pathway for mid-market and large corporate buyers. NZCB’s reverse auction process creates competition among developers bidding for member offtake, resulting in pricing that beats market benchmarks quarter after quarter.
For information on joining the NZCB, please contact NZCB@sustainround.com.