
August 10, 2026
This quarter’s NZCB VPPA Opportunity Index reviews the key market forces and what they mean for corporate buyers. Below is a condensed version of the Index available to everyone. SR Inc Member-Clients and NZCB participants can view the Index’s full qualitative and quantitative analysis, hub-by-hub cashflow modeling, and procurement guidance in the Digital Library on SR Inc’s Member Client Portal. To learn more, please contact NZCB@sustainround.com.
SR Inc’s complete Q2 2026 NZCB VPPA Opportunity Index includes:
- Hub-by-hub cashflow modeling across all active U.S. VPPA hubs (wind and solar)
- Trailing 12-month and 15-year forward cashflow projections per 10MW offtake
- Comparison of VPPA economics vs. unbundled EAC strips across all active hubs
- SR Inc’s earned price indicator (22-year wind and solar realized price trends)
- Detailed SR Inc guidance on project selection, FEOC compliance, and procurement strategy
- Full quantitative methodology and data source documentation
Key Market Themes
1. Corporate Clean Energy Deal Flow Remains Active and Consolidated
Corporate clean energy deal flow remains robust, with 13.4 GW of transactions announced in Q1 2026 according to CEBA. Solar remains the dominant technology in the announced pipeline, and clean-firm interest – nuclear, geothermal, and gas-with-CCS – continues to build alongside it, reflected this quarter in Fervo Energy’s $1.89 billion geothermal IPO, the largest climate-tech IPO of the year.
The market continues to consolidate around well-resourced buyers: the number of unique participants fell 40% year-over-year in 2025, and the data-center segment signed over 70% of North American renewable PPAs, with hyperscalers such as Google and Meta accounting for over 11 GW combined in Q1. NZCB’s aggregation model remains essential for mid-market buyers to secure supply and pricing terms otherwise reserved for hyperscale-level commitments.
2. Wind VPPA Prices Rise While Solar Holds Flat
SR Inc analysis shows top-quartile offered wind VPPA prices rose 18% over the prior 12 months, while solar prices held essentially flat (−0.1%) – a divergence from Q1 2026, when wind rose 17% and solar rose 3%. Developers continue to cite structural cost drivers: tariffs, rising insurance premiums, labor and EPC cost inflation, FEOC-compliance costs, and federal permitting constraints, which are unlikely to reverse in the near term.
There are offsetting signals on the solar side: SEIA reported a roughly 3% year-over-year decline in utility-scale PV system costs, aided by the February repeal of IEEPA tariffs and the expiration of Section 201 tariffs on imported crystalline silicon cells and modules. LevelTen also flagged SPP West as an emerging PPA region following SPP’s April 1 service-territory expansion into Wyoming, Colorado, and beyond.
3. The Tax Credit Cliff Has Passed: Life After July 4, 2026
The OBBBA’s July 4, 2026 closure of the tax-credit safe-harbor window has now taken effect. Projects that did not safe-harbor before this date carry structurally higher costs; on the LevelTen platform, tax-credit ineligibility has been observed to raise PPA prices by as much as 2x for the same project.
WoodMac’s quantification of the utility-scale safe-harbored solar pipeline indicates 216–240 GWdc across the U.S., most of it locked in before FEOC requirements began, supporting strong utility-scale buildout through 2030. On the wind side, construction starts accelerated 8% year-over-year into Q1 2026 and firm turbine orders reached 1.1 GW – a fivefold increase – as developers raced against the milestone. NZCB continues to prioritize the finite, credit-qualified pipeline.
4. Geopolitics and U.S. Electricity Price Risk
Conflict in the Middle East and disruption around the Strait of Hormuz drove crude oil from just below $60 at the start of 2026 to over $110, an increase of roughly 80%. Crude, however, makes up less than 1% of U.S. electricity supply; the dominant fuel is natural gas. Because the U.S. remains export-capacity-constrained for gas, its “trapped” surplus has, so far, decoupled domestic power prices from international oil volatility – March 2026 realized ERCOT prices came in around $34/MWh, versus ~$35/MWh in 2025.
Over the longer horizon, the direction for demand is up. A March 2026 EIA study showed that in Texas, average wholesale prices at the ERCOT North hub could run 78.9% higher than the $47.39/MWh February STEO forecast under high data-center load. WoodMac’s July 2026 Horizons analysis forecasts Henry Hub rising toward a real ~$5/MMBtu by 2035 (vs. $3.15–$3.25/MMBtu in Q2 2026), flowing through to structurally higher power prices – exactly the fossil-fuel volatility that long-tenor VPPAs are designed to hedge.
5. Evolving Standards: GHGP and SBTi
The GHGP’s Scope 2 Guidance revision is in consultation, with final publication targeted for late 2027. SBTi finalized its Corporate Net-Zero Standard (CNZS) V2.0 in June 2026, with adoption required for participants setting targets after February 1, 2028. V2.0 introduces updated Scope 1, 2, and 3 target-setting approaches, Scope 2 deliverability and hourly reporting requirements, and mandatory climate transition plans.
Long-term contracts signed before February 1, 2027 qualify under SBTi’s legacy clause, allowing companies to apply those EACs under current Scope 2 guidance. Because a conservative reading of section C30.3 could limit REC application within the Eastern Interconnection, Western Interconnection, and ERCOT separately, many buyers are prioritizing long-term contracts before the legacy deadline. However, SR Inc’s read of the CNZS V2.0 Executive Summary insists that further aggregation for a new long-term contract should be allowed as well. Notably, GHGP reported that 82% of 429 companies expressed no or low support for mandatory hourly matching, making the final requirements more likely to be preferential than mandatory.
Electricity Market Trends
Renewable Capacity Additions
Solar and battery storage accounted for 91% of all new U.S. electricity-generating capacity added in Q1 2026 – with solar alone at 60%. The solar industry installed 7.8 GWdc in Q1 2026 (a 27% year-over-year decline reflecting seasonality plus the pull-forward ahead of 2026 FEOC guidelines), and WoodMac projects a doubling of the U.S. solar fleet over five years even as annual additions plateau around 43 GW per year.
Wind’s greenfield outlook through 2030 rose 5% quarter-over-quarter despite policy phaseout, with 53.6 GW expected to connect over the next five years and construction accelerating 8% year-over-year ahead of the July 2026 milestone. Storage set a record in Q1 (3.3 GW / 8.4 GWh installed) and is projected to reach 200 GW / 655 GWh of cumulative capacity by 2031, increasingly bundled with solar and shifting toward longer durations as market rules reward sustained output.
Electricity Demand Outlook
U.S. electricity demand growth continues to accelerate. ICF projects total demand rising 21% by 2030 and 39% by 2035, warning that only ~26 GW of excess capacity exists today (~3% of U.S. capacity) and that meeting demand will require roughly 445 GW of additions by 2030 versus only ~68 GW expected in 2026. AI data centers are the defining driver: BNEF projects them reaching ~20% of U.S. electricity by 2035 (118 GW by 2030, 194 GW by 2035).
ERCOT is the epicenter of both growth and forecast uncertainty, forecasting a record ~92.2 GW summer peak in 2026 – about 8.5 GW above 2025. Longer-term forecasts span a wide range, and buyers should treat any single number with caution: SemiAnalysis estimates roughly 311 GW of ERCOT’s ~410 GW interconnection queue is speculative “phantom” demand. More realistic third-party forecasts cluster around 5–6% annual ERCOT growth – still enough to substantially increase demand within the term of a VPPA.
Q2 2026 VPPA Market
Top-quartile wind VPPA offer prices reached new highs in Q2 2026, up 18% over the prior 12 months, while solar offer prices held roughly flat. The primary cost drivers are structural and supply-side – tariffs, insurance premiums, labor and EPC cost inflation, FEOC-compliance costs, and federal permitting constraints – and are unlikely to reverse in the near term. With the OBBBA safe-harbor window now closed, ITC/PTC eligibility is further reducing the effective supply of qualifying projects, adding upward price pressure through supply-demand imbalance.
Big-tech competition for capacity remains a defining dynamic, with hyperscalers signing over 70% of North American renewable PPAs and dominating ERCOT deal volumes. NZCB’s reverse-auction structure provides participants with aggregated market leverage, closing the gap on hyperscaler dominance and consistently delivering pricing that beats market benchmarks.
SR Inc’s Q2 2026 analysis of Purchaser-Caused EAC (PC EAC) costs shows the average modeled cost of VPPA-sourced EACs was $26.25 per PC EAC ($19.77 for solar and $32.72 for wind), up from $17.63 in Q2 2025. These figures reflect market offer prices, not SR Inc procurement results; NZCB procurements consistently achieve meaningfully better pricing through SR Inc’s professionally managed reverse auction process.
Quantitative Analysis
To better quantify U.S. VPPA market dynamics, the NZCB has published the NZCB VPPA Opportunity Index quarterly since 2019 to help advance SR Inc’s mission to accelerate the development and adoption of best practices in more sustainable business. The NZCB VPPA Opportunity Index enables comparison of potential wind and solar VPPA performance across U.S. hubs using common analytics. Based on proprietary SR Inc analytics and data from LevelTen Energy and Resurety, it reflects both prior actual (backcast) performance and carefully modeled forward pricing. Noteworthily, the Index is based upon VPPA offers (which NZCB participants view as “marketing prices”), not executed transactions (which include multiple buyer-favorable protections), made over the prior quarter.
- Top quartile offered wind VPPA prices across the country were up 18% on average from the previous 12 months, while offered solar VPPA prices were down 0.1%.
- Realized electricity prices have remained low but increased from the prior year. Average trailing 12-month (TTM) realized wind electricity prices in Q2 2026 were up 15% (to $27.38) across active hubs from the TTM in Q2 2025 and realized solar electricity prices were up 5% (to $33.25) from Q2 2025.
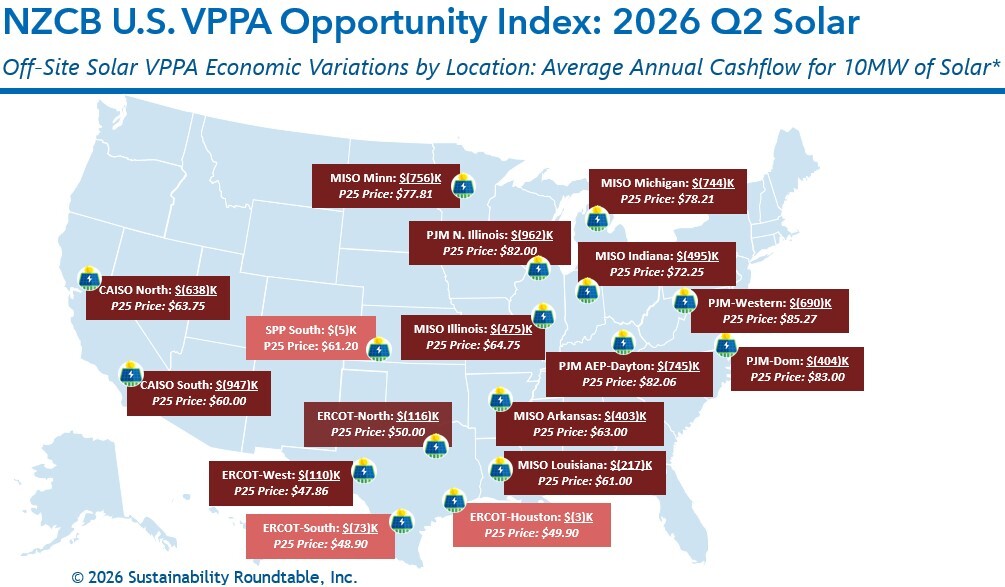
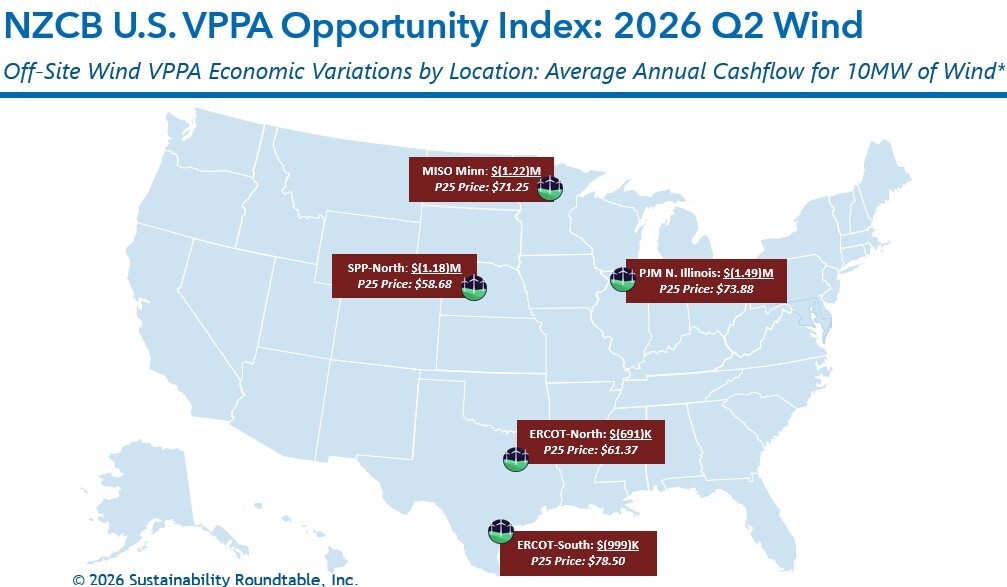
- The combination of higher VPPA prices and higher realized prices caused expected cashflows in the TTM for a 10MW wind VPPA to drop $190K from Q2 2025 to Q2 2026 (to negative $1.49M) and drop $28K (to negative $799K) for a 10MW solar VPPA.
- Our longer-term view Opportunity Index shows that average modeled cashflow through Q2 2041 per 10MW VPPA across active hubs decreased $342K in Q2 (to negative $1.12M) versus Q1 2026 for wind and decreased $44K (to negative $458K) for solar.
- In Q2, wind VPPAs modeled to be less expensive in none of active hubs versus buying reputationally riskier unbundled EACs (based on the typical average cost today of $2.94 for a 10-year strip of unbundled EACs as of July 2026), and solar VPPAs modeled to be less expensive in 12% of all hubs.
- The average modeled hub annual cashflow for a 10MW wind VPPA would have been $1.22M more expensive than buying the equivalent number of reputationally riskier multi-year unbundled EAC strips, and the average modeled hub annual cashflow for a 10MW solar VPPA would have been $528K more expensive.
- Price modeling shows that ERCOT solar and SPP South solar continued to present the best modeled opportunities for breakeven cashflow in Q2. The average modeled annual cashflow for a 10MW ERCOT solar VPPA was negative $75K and negative $5K for SPP South solar.
- For wind, price modeling did not reveal any opportunities for near breakeven cashflow in Q2.
- To underscore the importance of NZCB’s procurement process, active 2026 Q2 NZCB procurements for PC EACs for to-be-built solar were at or below the Q2 P25 VPPA prices for the same hubs, despite also providing more than a dozen specially sought and secured buyer-favorable risk management terms required by risk-averse, environmentally motivated corporate procurement teams.
The NZCB VPPA Opportunity Index intentionally simplifies complex markets. Nevertheless, many NZCB participants find the rendering helps them begin to understand the market dynamics and financial implications of VPPA-based renewable energy strategies.
When NZCB participants wish to pursue specific VPPA opportunities, SR Inc offers stakeholder briefings and detailed, customized analytics before transacting. This bespoke financial, legal, and market expertise helps VPPA offtakers to develop a timely procurement strategy; implement the procurement strategy in an auditable way; and structure, contract, and negotiate the transaction in a buyer-favorable manner. SR Inc supports NZCB buyers throughout the corporate procurement process, helping them navigate rapidly changing markets such as the one we are in today.
About the NZCB
The Net Zero Consortium for Buyers (NZCB) is a buy-side-only procurement consortium operated by SR Inc, designed to give corporate buyers access to utility-scale renewable energy procurement on terms previously available only to large utilities and hyperscale technology companies. NZCB members benefit from aggregated purchasing scale, SR Inc’s reverse auction structure (which consistently produces below-market pricing), and SR Inc’s buy-side-only advisory model, ensuring that every recommendation reflects the interests of corporate buyers.
Through NZCB, companies with 10 MW or more of individual offtake capacity in a given market can participate in transactions that deliver premium pricing, project quality, and contractual protections. SR Inc’s VPPA 2.0 model democratizes access to this procurement pathway for mid-market and large corporate buyers. NZCB’s reverse auction process creates competition among developers bidding for member offtake, resulting in pricing that beats market benchmarks quarter after quarter.
This summary is published for informational purposes and reflects SR Inc’s analysis of publicly available market data. Full quantitative analysis, hub-level modeling, and procurement guidance are available exclusively to NZCB participants. For information on joining the NZCB, please contact NZCB@sustainround.com.