
November 10, 2026
This quarter’s Buyers Consortium U.S. Virtual Power Purchase Agreement (VPPA) Opportunity Index reviews the key market forces and what they mean for corporate buyers. Below is a condensed version of the Index available for free. SR Inc Member-Clients and Buyers Consortium participants can view the Index’s full qualitative and quantitative analysis, hub-by-hub cashflow modeling, and procurement guidance in the Digital Library on SR Inc’s Portal. To learn more, please contact NZCB@sustainround.com.
Executive Summary
Three main forces shaped the Q3 2026 VPPA market. (1) Section 232 tariffs raised development costs and pushed solar power purchase agreement (PPA) offer prices higher for projects that have not yet secured major equipment. (2) The supply of projects that qualify for Inflation Reduction Act (IRA)-era tax credits is shrinking, and projects without them are expected to need PPA prices 40–50% or more higher (LevelTen, June 2026). And (3) the Science Based Targets initiative’s (SBTi) November 2026 proposals would, if adopted, let VPPAs with new projects count nationwide after the February 1, 2027 legacy deadline, easing what had been a hard cutoff (SBTi, November 2026).
SR Inc’s AP XI request for proposals (RFP), its 11th aggregated procurement, drew 153 proposals and showed advanced-stage projects to be far more de-risked for contracting than earlier-stage projects without secured panels. SR Inc’s modeling shows VPPA economics across the U.S. were mostly negative, with limited bright spots in ERCOT solar, SPP solar, and in Buyers Consortium procurements that beat benchmarks on price and terms.
| Theme | Key Insight | Risk Management |
|---|---|---|
| Tariffs Push Prices Up | Section 232 tariffs (signed August 6) add a 15% tariff plus minimum import prices from polysilicon through modules. SR Inc estimates they add $2–8.50/MWh to PPA prices, based on comparing its AP XI RFP with prior RFPs. Rising interest rates and producer prices add pressure, and ~44 GW of wind remains stalled in Department of Defense (DoD) and Federal Aviation Administration (FAA) review. | Many offers have already been repriced, and new-build wind supply keeps shrinking. Offers for projects without secured equipment carry the most repricing risk. |
| Short-Term Costs, Long-Term Value | Top quartile offered VPPA prices rose 12% for wind and 5.6% for solar over the prior 12 months. High renewables penetration and lower gas prices are holding down near-term prices, while demand growth points to rising prices later in the decade. Buyers Consortium procurements came in at or below Q3 P25 prices. | Buyers should expect net costs early in a contract, with economics improving over time. Favorable economics are concentrated in ERCOT and SPP South solar, making ISO selection and procurement process decisive. |
| Record Demand, Diverging Prices | U.S. electricity consumption is forecast to hit records of 4,288 TWh in 2026 and 4,356 TWh in 2027, with commercial sales, which include data centers, overtaking residential sales in 2026. Bank of America projects U.S. demand growing 4.1% a year through 2030. The U.S. Energy Information Administration (EIA) forecasts U.S. wholesale prices up 11% in 2026, led by a 41% jump in PJM, while ERCOT kept prices low despite an all-time demand record of 91 GW on July 22, as new solar and storage outpaced load growth. | Rising demand and tight supply point to higher power prices over the long term, strengthening the case for fixed-price VPPAs as a hedge. With data center buyers competing for the same projects, the most advanced, de-risked supply is in high demand. |
| Standards and Tax Credit Clocks Diverge | The Greenhouse Gas Protocol (GHGP) (October 2026) is moving toward two market-based Scope 2 methods, with final publication now slated for Q4 2028. The SBTi V2.0 legacy window closes February 1, 2027, but as of November 2026, SBTi’s “proposed interpretations and limited-scope revisions” on Electricity Criteria could allow new-project VPPAs to count nationwide. | Contracts signed before February 1, 2027 carry legacy-clause certainty while SBTi finalizes its proposals. Waiting for final GHGP guidance in late 2028 may run past the point where tax-credit-eligible projects, which must be placed in service by December 31, 2030, can still be financed. |
| Election Adds Policy Uncertainty | The November 3 midterms put data centers under policy review, with an estimated 47 GW of planned projects facing moratorium risk. The Senate advanced bipartisan permitting reform, and the results raised hopes for restoring wind and solar tax credits, though any restoration would face a likely presidential veto. | Policy changes will take time and are unlikely to ease near-term supply constraints. Projects that already qualify for tax credits and have secured equipment remain the most certain path to new clean energy. SR Inc will report key updates in the next Opportunity Index. |
What SR Inc’s Full Analysis Includes
- Hub-by-hub VPPA cashflow modeling for wind and solar across all active U.S. hubs
- Findings from SR Inc’s AP XI RFP on how development stage and equipment procurement affect offer pricing
- SR Inc’s guidance on hub selection, project screening for Section 232 tariff exposure, and contract structure
- SR Inc’s five-tier risk framework and the role of Purchaser-Caused Energy Attribute Certificates (PC EACs) under evolving SBTi and GHGP rules
- Full methodology, data sources, and source list
Key Market Themes
Development Stage Separates De-Risked Projects: SR Inc’s AP XI RFP
SR Inc’s AP XI RFP drew 153 proposals this quarter. Projects at an advanced stage of development were considerably more de-risked and price stable, while projects in earlier construction phases that had not yet secured panels exhibited price increases. With Section 232 tariffs taking effect December 4, projects that have already procured modules are largely insulated from the new duties, whereas earlier-stage projects remain exposed to repricing before or after contract signature.
Tariffs Return Solar PPA Prices to an Upward Path
SR Inc’s analysis showed the top quartile offered solar VPPA prices rose 5.6% from the prior 12 months. The quarter’s primary pricing driver was the Section 232 proclamation signed August 6, 2026 (SEIA, September 2026), which imposes a 15% tariff plus minimum import prices on polysilicon ($21/kg), ingots and wafers ($100/kg), cells ($0.22/W), and modules ($0.38/W), effective December 4, 2026, stacking on existing antidumping and countervailing duties (AD/CVD) and Section 301 duties (White & Case, August 2026). LevelTen analysis (Q3 2026) shows imported module prices rising more than 40%, and developers report PPA price impacts of roughly $3–7/MWh, highest in northern markets where solar production is lower. Proposals in SR Inc’s AP XI RFP reflected tariff impacts of $2–8.50/MWh. LevelTen reports that solar prices rose in every ISO except PJM (−0.2%) and CAISO (−8.2%), and ERCOT’s P25 (top 25%) solar price exceeded $50/MWh for the first time.
Equipment sourcing faces further uncertainty from the Federal Communications Commission’s (FCC) July 28 addition of foreign-produced inverters to its Covered List and an August 26 Executive Order restricting imports of power generation equipment from covered foreign entities, with implementing guidance due by about December 24, 2026 (SEIA, September 2026).
Additional Cost Drivers: Inflation and Interest Rates
The U.S. Producer Price Index (PPI) for final demand rose 1.3% in September 2026, its largest monthly increase since March 2022, and 6.3% over the prior 12 months, led by a 10.8% jump in energy prices (Bloomberg, October 15, 2026). The Federal Reserve raised rates to 3.75–4.00% in September, its first hike in three years, then held in October (U.S. Bank, October 2026), and the 10-year Treasury yield is above 5% (CNBC, October 28, 2026). Because renewable developers pay most of their costs upfront, higher rates feed directly into PPA prices.
Wind Supply Remains Constrained by Federal Permitting
SR Inc’s analysis showed top quartile offered wind VPPA prices rose 12% from the prior 12 months, and SR Inc’s modeling found no wind hub near breakeven in Q3. The DoD stopped countersigning mitigation agreements in August 2025 and brought reviews to a standstill by May 2026, leaving roughly 44 GW of wind stalled in DoD and FAA review (LevelTen, Q3 2026). On August 6, 2026, a federal court in Oregon issued a nationwide preliminary injunction ordering DoD to resume reviews (Holland & Hart), but as of LevelTen’s October 2026 report, Determinations of No Hazard and mitigation agreements were not yet being issued. Section 232 duties on steel, aluminum, and copper, plus an open Section 232 investigation into wind components, add cost pressure, and some buyers are turning to operational and repowered wind projects for less development risk.
Tax Credit Timelines and Foreign Entity of Concern (FEOC) Guidance
The One Big Beautiful Bill Act’s (OBBBA) July 4, 2026 beginning-of-construction deadline has passed. Wood Mackenzie and SEIA (September 2026) estimate the safe-harbored solar pipeline at up to 240 GWdc, which must be placed in service by December 31, 2030 to receive tax credits; projects that missed the July deadline face a December 31, 2027 placed-in-service cutoff. Because signed PPAs are often a prerequisite for financing, LevelTen (Q3 2026) identifies Q4 2027 as the general period by which developers will need signed PPAs to begin construction and still meet the end-of-2030 deadline.
As the supply of tax-credit-eligible projects dwindles, developers are modeling PPA price increases of 40–50% across ISOs for projects without tax credits, and early ERCOT transaction data points to VPPA price increases of up to 120% (LevelTen, June 2026). FEOC guidance remains incomplete: Treasury’s interim Notice 2026-15 (February 2026) addressed material assistance cost ratio (MACR) mechanics but left prohibited foreign entity definitions unresolved, and Treasury must publish new safe harbor tables by December 31, 2026.
Evolving Standards: GHG Protocol Scope 2 and SBTi V2.0
On October 16, 2026, the GHG Protocol reported that its Independent Standards Board supports two market-based Scope 2 methods. Method 1 would require hourly matching, deliverability, and incrementality; Method 2 retains the 2015 Scope 2 Guidance until a to-be-determined date, after which Method 1 would be required where qualifying data exists. A consolidated public consultation is slated for Q2 2027 and the final joint GHG Protocol-ISO Corporate Standard for Q4 2028. SR Inc’s view is that the GHGP will either use a legacy clause alongside its uniform effective date or set an effective date for requiring Method 1 likely well into the next decade.
SBTi’s Corporate Net-Zero Standard (CNZS) V2.0, published June 11, 2026, remains the only finalized framework. It takes effect for validations on February 1, 2027 and becomes mandatory for new targets in February 2028. On November 5, 2026, SBTi opened a minimum 30-day public comment period on proposed revisions to its electricity criteria, with final publication targeted for January 2027 (SBTi, November 2026). Four proposals matter most for U.S. VPPA buyers:
- Deliverability regions: an interim interpretation would define deliverability regions as wide-area synchronous grids. In the U.S., that means three regions (the Eastern Interconnection, the Western Interconnection, and ERCOT) rather than individual ISOs.
- New-project VPPAs: project-specific instruments, including physical and financial PPAs, could be applied anywhere within the project’s country if delivery begins within 36 months of the project’s commissioning or repowering. A U.S. buyer could apply a VPPA with a new ERCOT project to load in any U.S. grid region.
- Legacy clause: outside the new-project carveout, a contract qualifies if it is fully executed and legally binding before February 1, 2027, even if delivery begins later.
- Generator age limit: the 15-year limit would formally exempt the same project-specific instruments for new or repowered projects.
Once finalized, these proposals would ease the deliverability constraint for buyers signing VPPAs with new projects. The February 1, 2027 deadline would then matter most for contracts with operating projects outside a buyer’s interconnection, and for buyers that want certainty before the revisions are finalized. SR Inc plans to submit comments to SBTi.
Procurement Timing Relative to Standards and Tax Credit Deadlines
The GHGP’s extended timeline and the tax credit placed-in-service deadline now run on different clocks. A buyer that waits for final GHGP guidance in Q4 2028 before soliciting offers would likely sign after safe-harbored tax credit projects can still be financed and built by December 31, 2030. Interconnection timing adds further pressure: developers report timelines converging on roughly three years as utilities depend on a small number of booked-up breaker suppliers, though ERCOT utilities have moved faster. Most of SR Inc’s Buyers Consortium members are accelerating their procurement timelines amid standard evolution.
Buyer Concentration and Supply
The Clean Energy Buyers Association’s (CEBA) Deal Tracker reports 22.9 GW of U.S. corporate clean energy deals announced from January through September 2026, with more than 13 GW in Q1 alone, showing the pace has slowed since (CEBA, May 2026). Procurement is concentrated: 99% of Q1 procurement came from a handful of technology buyers, and only three new buyers entered in the first half (LevelTen, Q3 2026). Supply is concentrated too. ERCOT accounts for roughly 35% of LevelTen offers, wind represents only about 10% of offer volume, and average offered terms were 15.2 years for solar and 15.3 years for wind.
Midterm Election Results and Demand and Supply Dynamics
The November 3 midterms put data centers, the main driver of new U.S. electricity demand, under policy review across much of the country, with proposals ranging from state-level moratoriums to a nationwide pause (TechCrunch, November 4, 2026). Allianz estimates that 47 GW of planned U.S. data center projects now face moratorium risk, and expects a slower, costlier, and more uneven buildout rather than an abrupt halt (Pexapark, November 6, 2026). A slower buildout is not a reversal: demand is still rising from electrification and manufacturing, and many forecasts have already been revised down to reflect data center delays.
On the supply side, the results reduce the risk of further rollbacks to clean energy support and raise investor hopes that wind and solar tax credits could be restored, though Democrats lack the majorities needed to override a presidential veto. On November 9, the Senate voted 73–25 to advance a bipartisan permitting reform bill (The New York Times, November 9, 2026), which still needs a final Senate vote and House approval. SR Inc will report key updates in the next Opportunity Index.
Electricity Market Trends and Insights
Renewable Energy Adoption and Electricity Price Trends
EIA (October 2026) expects renewables’ share of U.S. generation to rise from 24% in 2025 to 27% in 2027. The latest Solar Energy Industries Association (SEIA) and Wood Mackenzie Solar Market Insight shows the U.S. installed 11.4 GWdc of solar in Q2 (one quarter behind this index), up 45% year over year, with utility-scale reaching 9.6 GWdc (+61%) as developers built out their safe-harbored pipelines. Utility-scale single-axis system prices rose 2% year over year, as a 2% module price decline was offset by higher balance-of-plant and logistics costs. Storage deployment hit a record 20.2 GWh in Q2 2026, with 71 GWh forecast for 2026 (SEIA and Benchmark Mineral Intelligence, September 2026).
Tandem solar panels are nearing commercial readiness, with Qcells the first to obtain UL and IEC certification for one (The New York Times, October 5, 2026). They could generate roughly 25% more electricity per footprint but cost an estimated three to three and a half times as much, and are unlikely to affect offer prices for projects contracting today.
Electricity prices. EIA’s October 2026 Short-Term Energy Outlook (STEO) forecasts U.S. wholesale prices averaging $52/MWh in 2026, 11% above 2025, with PJM up 41% and Northwest Mid-Columbia down 23%, and a modest decline to $49/MWh in 2027. Commercial retail prices, the more relevant benchmark for most corporate buyers, are forecast at 14.0 cents/kWh in 2026 and 14.2 cents in 2027, up from 13.4 cents in 2025 (EIA STEO Table 7a, October 2026).
ERCOT prices have yet to rise. ERCOT’s Summer 2026 Operational and Market Review found real-time prices lower in summer 2026 than in 2024 or 2025, as solar additions outpaced large-load growth. On the July 22 record-demand day, real-time prices peaked at just $378/MWh, compared with the $5,000/MWh cap reached on the prior record day in August 2024 (IEEFA). EIA expects ERCOT North Hub prices to fall about 10% in 2026 to $33.68/MWh before edging up to $34.58/MWh in 2027. Longer-term forecasts point to the steepest increases later in the decade: Modo Energy’s Q1 2026 outlook has around-the-clock ERCOT prices peaking near $128/MWh in 2033 (Modo Energy, April 2026), and the REsurety forward price forecasts SR Inc uses in its modeling likewise generally show ERCOT prices rising over typical VPPA contract horizons.
VPPA settlement depends on realized prices at the project’s hub relative to the strike price. SR Inc’s analysis of trailing 12-month (TTM) realized prices showed an 8% increase for wind (to $25.50) and a 13% increase for solar (to $38.52), but both remain well below current offered VPPA prices.
Electricity Demand Outlook
EIA (October 2026) projects record U.S. electricity consumption of 4,288 TWh in 2026 and 4,356 TWh in 2027, up from 4,195 TWh in 2025, driven by data centers and electrification. ERCOT set an all-time demand record of 91,134 MW on July 22, 2026 (ERCOT, September 2026). ERCOT’s preliminary Long-Term Load Forecast projects up to 367,790 MW of peak demand by 2032, but ERCOT itself cautioned the figure may be inflated (Utility Dive, April 2026); for comparison, its preliminary forecast implied roughly 112,000 MW for 2026, against an actual peak of about 91 GW.
On August 3, ERCOT paused its Batch Zero large-load study for data centers and crypto facilities of 75 MW or more, and Governor Abbott paused data center grid interconnections in August and extended the freeze to environmental permits until ERCOT’s audit concludes, likely at year-end (LevelTen, Q3 2026). PJM’s 2028/2029 Base Residual Auction (July 2026) cleared at the $325/MW-day cap for a third consecutive auction, and Pennsylvania’s Executive Order 2026-05 (August 18, 2026) requires data centers to pay all utility costs to interconnect them to the grid.
The general demand outlook remains high. Bank of America (Utility Dive, July 2026) projects U.S. electricity demand growing 4.1% annually through 2030, requiring more than 230 GW of new generation against roughly 93 GW planned by regulated utilities. Taken together, these trends point to continued upward pressure on VPPA prices and competition for capacity, with state-level data center controls affecting the timing, though not the direction, of load growth.
Analysis of the Q3 2026 VPPA Market
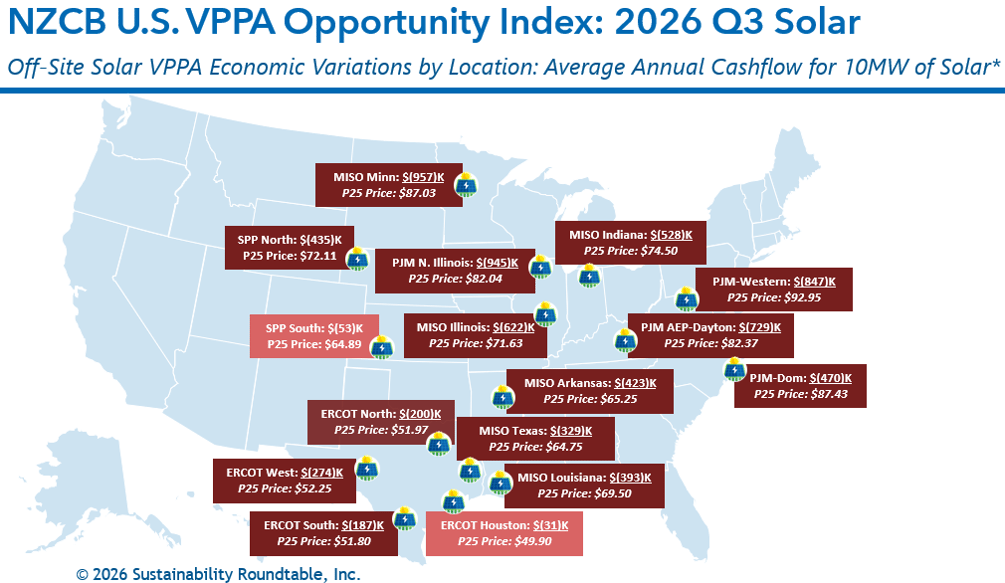
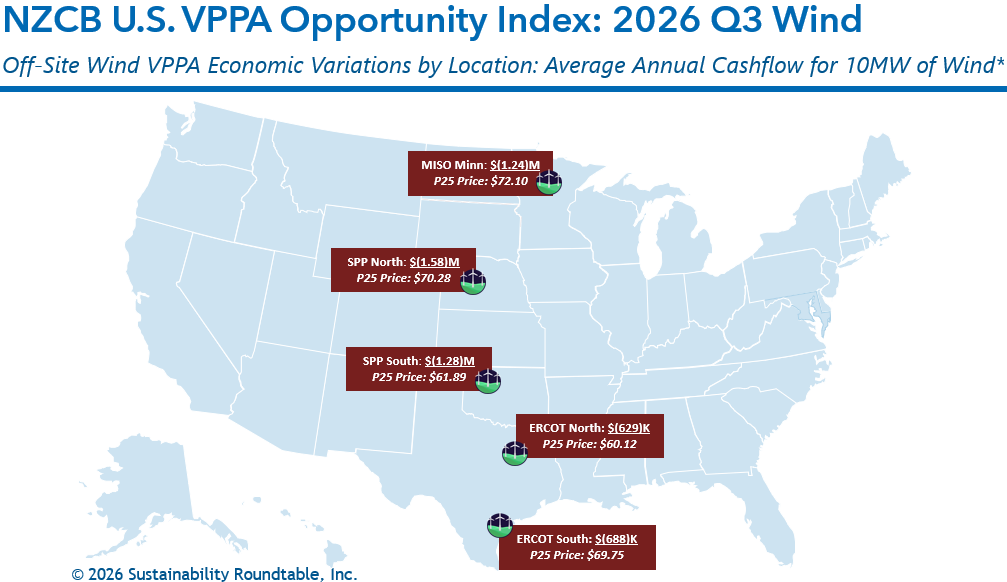
Offered VPPA prices rose faster than realized electricity prices in Q3, leaving modeled VPPA economics negative at most hubs with active VPPA offers. SR Inc’s modeling identifies SPP South solar and ERCOT solar as the best opportunities for breakeven cashflow; no wind hub reached near breakeven.
Unbundled Energy Attribute Certificates (EACs) averaged about $2.59 for a 10-year strip as of October 2026, according to data from ACT Commodities. PC EAC costs for Q3 averaged $34.34/EAC for wind and $17.88 for solar, compared with $32.72 for wind and $19.77 for solar in Q2. SR Inc’s earned price indicator shows Q3 22-year wind earned prices down 4% and solar down 1% against Q2.
Key Findings: Q3 2026
Q3 2026 takeaway: Although modeled economics across the U.S. as a whole were mostly negative, there were limited bright spots in ERCOT and SPP and in Buyers Consortium procurements that beat benchmarks on price and terms.
-
Top quartile offered wind VPPA prices across the country were up 12% on average from the previous 12 months, and offered solar VPPA prices were up 5.6%.
-
Realized electricity prices have remained low but increased from the prior year. Average TTM realized wind electricity prices in Q3 2026 were up 8% (to $25.50) across active hubs from the TTM in Q3 2025, and realized solar electricity prices were up 13% (to $38.52).
-
The combination of higher VPPA prices and higher realized prices caused expected TTM cashflows for a 10 MW wind VPPA to drop $370K from Q3 2025 to Q3 2026 (to negative $1.49M) and to increase $37K (to negative $756K) for a 10 MW solar VPPA.
-
Average modeled cashflow through Q3 2041 per 10 MW VPPA across active hubs decreased $60K in Q3 (to negative $1.08M) versus Q2 2026 for wind, and decreased $6K (to negative $464K) for solar.
-
In Q3, wind VPPAs modeled to be less expensive than reputationally riskier unbundled EACs in none of the active hubs (based on the typical average cost today of $2.59 for a 10-year strip of unbundled EACs as of October 2026), and solar VPPAs modeled to be less expensive in 13% of active hubs. The average modeled hub annual cashflow for a 10 MW wind VPPA would have been $988K more expensive than buying the equivalent number of multi-year unbundled EAC strips, and $402K more expensive for a 10 MW solar VPPA.
-
ERCOT solar and SPP South solar continued to present the best modeled opportunities for breakeven cashflow in Q3. The average modeled annual cashflow for a 10 MW ERCOT solar VPPA was negative $173K, and negative $53K for SPP South solar. For wind, price modeling did not reveal any opportunities for near breakeven cashflow in Q3.
Buyers Consortium Procurement Results
Active Q3 2026 procurements for PC EACs from to-be-built solar were at or below the Q3 P25 VPPA prices for the same hubs, yielding positive projected cash flow over term for buyers while also securing more than a dozen buyer-favorable risk management terms required by risk-averse, environmentally motivated corporate procurement teams.
About the Buyers Consortium
The SR Inc Buyers Consortium (formerly the Net Zero Consortium for Buyers (NZCB)) is a buy-side-only procurement consortium operated by SR Inc, designed to give corporate buyers access to utility-scale renewable energy procurement on terms previously available only to large utilities and hyperscale technology companies. Buyers Consortium members benefit from aggregated purchasing scale, SR Inc’s reverse auction structure (which consistently produces below-market pricing), and SR Inc’s buy-side-only advisory model, ensuring that every recommendation reflects the interests of corporate buyers.
Through the Buyers Consortium, companies with 10 MW or more of individual offtake capacity in a given market can participate in transactions that deliver premium pricing, project quality, and contractual protections. SR Inc’s VPPA 2.0 model democratizes access to this procurement pathway for mid-market and large corporate buyers. SR Inc’s reverse auction process creates competition among developers bidding for member offtake, resulting in pricing that beats market benchmarks quarter after quarter.
This summary is published for informational purposes and reflects SR Inc’s analysis of publicly available market data. Full quantitative analysis, hub-level modeling, and procurement guidance are available exclusively to NZCB participants. For information on joining the NZCB, please contact NZCB@sustainround.com.