July 19, 2023
The First Hope for VPPA Price Relief Dawns as Costs & Returns Narrow
SR Inc was pleased to guide and represent more than a dozen Member-Clients in independent and aggregated virtual power purchase agreements (VPPAs) through the Net Zero Consortium for Buyers (NZCB) in Q2 2023 in both the U.S. and Europe. In Q2, SR Inc also announced that the NZCB achieved 50% of its goal of enabling SR Inc Member-Clients to cause a gigawatt of new renewable energy capacity by 2025.
Like most companies, most SR Inc Member-Clients have electric loads that are not geographically concentrated and are, therefore, keenly interested in VPPAs. Most Member-Clients can only smartly pursue VPPAs if they aggregate their procurement with other high-credit corporates to increase their economies of scale and intellect and be able to command the most Corporate Buyer-favorable transaction structuring, ESG impact terms, and price. This is why the NZCB’s auditable corporate procurement process and Reverse Auctions (a proprietary and web-enabled process designed to create Corporate Procurement-dictated transaction structuring and ESG impact terms) have become core to a growing number of SR Inc Member-Clients’ decarbonization strategies.
This process allows SR Inc Member-Clients to accelerate towards 100% renewable energy while causing incremental capacity at utility scale to advance their Science Based Targets Initiative-aligned decarbonization journeys. To complement their enterprise decarbonization strategies, SR Inc advises Member-Clients to systemize their support for efforts to decarbonize their local and national electrical grids through industry and public policy collaborations that can now be assisted by RMI’s new ZEROgrid Initiative.
Although conditions in the North American VPPA market have eased for corporate buyers in 2023 versus 2022, developers are continuing to face interconnection backlogs, uncertainty from the Uyghur Forced Labor Prevention Act and the Auxin tariff circumvention case, higher interest rates, and the lingering impacts of Russia’s invasion of Ukraine. These factors, in addition to record high corporate interest in long-term corporate contracting for utility-scale renewable energy, has led to continued increased VPPA pricing in the U.S. market overall. In the U.S., the IRA is expected to dramatically increase overall supply over the next decade, but as the IRS releases IRA-related guidance, developers are continuing to evaluate exactly how their projects could benefit, which has protracted some VPPA negotiations.
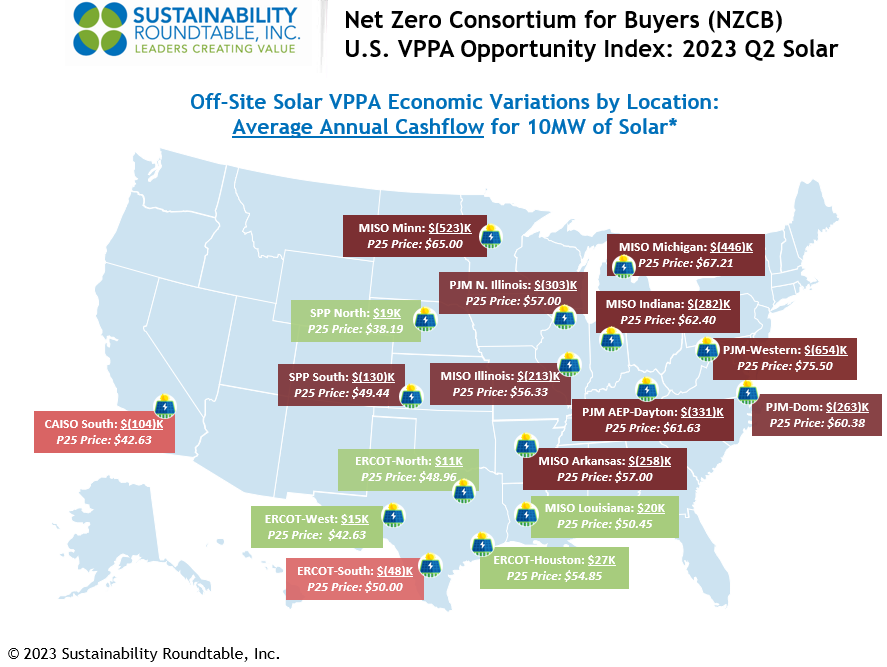
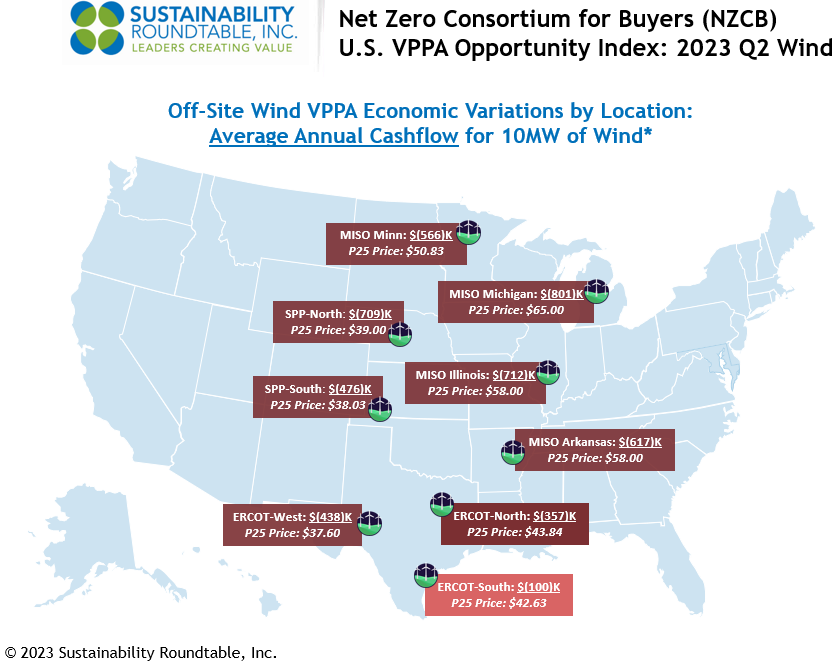
With that said, SR Inc does see evidence in our multiple active aggregations in both the U.S. and Europe of a move from a pronounced sellers’ market to a more balanced market, wherein the best positioned, and most ambitious developers are willing to pass on lower costs to Buyers. Although the top quartile (i.e., the “P25” price that is most attractive to Buyers) solar VPPA prices were higher in Q2 versus the prior year, they did decline slightly (for all hubs aside from ERCOT, likely due to regulatory uncertainty and basis risk concerns in West Texas) from Q1 for the first time in three years. P25 wind VPPA prices have continued to rise, making wind projects financially less attractive than solar at present.
Another factor that SR Inc monitors closely when advising clients on VPPAs is historical and projected earned wind and solar prices across hubs. In Q2 versus Q1, our 22-year earned price indicator decreased 3.8% for wind and 4.3% for solar across active VPPA hubs, largely due to a decline in natural gas prices down to more historically typical levels. However, record heat waves over the past month will undoubtedly push prices higher in Q3 as electric demand spikes due to air conditioning needs. Over the longer term, as the country electrifies, overall electricity demand is expected to rise, increasing the need for clean energy and its associated infrastructure.
To better quantify these market dynamics, the NZCB has been proud to publish the NZCB VPPA Opportunity Index quarterly since 2019 to help advance our mission to accelerate the development and adoption of best practices in more sustainable business. The NZCB VPPA Opportunity Index enables a comparison of potential wind and solar VPPA performance across U.S. hubs using common analytics. It reflects both prior actual (backcast) performance and forward carefully modeled pricing and is based on proprietary SR Inc analytics and key data sources including those provided by SR Inc partners LevelTen Energy and REsurety. We call readers’ attention to the fact that the Index is based upon VPPA offers, not executed transactions, that were made over the prior quarter.
Key findings from our Q2 analysis include:
- Top quartile offered wind VPPA prices across the country were up 16% on average from the previous 12 months, while offered solar VPPA prices were up 11%.
- In the past quarter, realized electricity prices corrected down to more historically typical levels. Average realized wind electricity prices in Q2 2023 were down 54% across active hubs from Q2 2022 and realized solar electricity prices were down 58% from the very high levels of Q2 2022.
- Our longer-term view Opportunity Index shows that average modeled cashflow through Q2 2038 per 10MW VPPA across hubs decreased $234K in Q2 versus Q1 2023 for wind and decreased $28K for solar.
- In Q2, wind VPPAs modeled to be less expensive in 11% of all active hubs versus buying reputationally inferior unbundled RECs (based on the current cost of a 10-year strip of national Green-e RECs at $4.00/REC), and solar VPPAs modeled to be less expensive than reputationally inferior unbundled RECs in 35% of all hubs.
- The average modeled hub annual cashflow for a 10MW wind VPPA would have been $387K more expensive than buying a 10-year strip of the equivalent number of reputationally inferior unbundled RECs, and the average modeled hub annual cashflow for a 10MW solar VPPA would have been $108K more
- Price modeling shows that ERCOT (most of Texas) solar continued to present modeled opportunities for better than breakeven cash flow in Q2. The average modeled ERCOT annual cashflow for a 10MW solar VPPA was $4K.
- MISO Louisiana and SPP North solar also presented possibilities for modeled positive annual cashflow in Q2 ($20K and $19K per 10MW, respectively).
- For wind VPPAs in Q2, price modeling shows that ERCOT South presented the best annual cashflow opportunity, which was negative $100K per 10MW.
- To underscore the importance of NZCB’s auditable, iterated procurement process, NZCB solar procurements in ERCOT North, MISO Illinois, and Europe continued in Q2 2023 to contract for VPPA prices on average more than 10% below the average offered Q2 P25 VPPA prices. This is even while securing Corporate Procurement-dictated structuring & ESG impact terms through NZCB’s proprietary and web-enabled Reverse Auction process.
The NZCB VPPA Opportunity Index is an intentionally simplified rendering of complex markets, but NZCB participants find it helpful in beginning to gain an understanding of VPPA market dynamics and financial implications for implementing their renewable energy strategies through VPPAs and aggregated VPPAs. In pursuing any specific VPPA opportunities, SR Inc works with NZCB participants to provide deep stakeholder briefings and detailed and custom analytics before transacting. This type of assistance that VPPA offtakers need requires financial, legal, and market expertise to drive timely procurement strategy development and implementation, transaction structuring, contracting, and negotiation services to create a successful and auditable corporate procurement process in rapidly changing markets.
*Methodology
- To calculate average annual cashflows, SR Inc multiplies 1) the difference of technology-shaped realized market prices (2016-2023) & forecasted technology-shaped electricity futures market prices (2023-2038) versus top quartile VPPA prices in each hub by 2) the typical total annual production for 10MW offtakes for wind and solar, respectively.
- SR Inc uses 36K MWh production per year for 10MW of wind and 24K MWh per year for 10MW of solar to provide “apples to apples” comparisons for both technologies across hubs.
- The top quartile VPPA price assumes a scaled offtake of at least 50MW, but SR Inc uses 10MW because it is typically the minimum individual corporate offtake required within 100+ MW aggregated procurements REPS manages for NZCB participants.
Data Sources
- The NZCB Opportunity Index is developed from proprietary analytics and multiple data providers, which include:
-
- LevelTen Energy PPA Price Index North America top quartile VPPA pricing data for Q2 2023 (all proposed projects of 8+ years)
- REsurety REmap actual average, technology-shaped realized market prices for Q3 2016-Q2 2023 and technology-shaped future market price forecasts for Q3 2023-Q2 2038 (as of July 14th, 2023) based on multiple electricity futures markets.
If you have any additional questions, or would like to learn more about the NZCB, contact info@sustainround.com.