July 25, 2024
NZCB Insights from the Field: A Return to a More Balanced Market
In the second quarter of 2024, the North American market for utility scale clean energy continued to move from a seller-declared “Sellers’ Market” to a more balanced market, at least when it comes to vitally important transaction structuring terms (e.g., full hub settlement, zero price floors, and firm pricing through term). At the same time, virtual power purchase agreement (VPPA) prices have remained elevated in most markets, with a notable exception being solar in ERCOT – which includes the most popular VPPA settlement hubs – where prices were modestly lower in Q2 compared to the prior four quarters. On the one hand, there has been a surfeit of new and varied developers with newly proposed projects with full permitting. These include a host of sophisticated European developers wanting more exposure to the American market, making arriving at fair transaction terms more efficient. On the other hand, there is an even larger number of buyers who want to cause new renewable energy generation through long-term VPPAs instead of buying reputationally risky unbundled RECs. Many of these buyers are concerned about deal-threatening political risk in Q4, creating an urgency that – in addition to stubbornly high interest rates – has kept VPPA prices relatively high for another quarter.
SR Inc had the privilege of guiding and representing more than a dozen Member-Clients in aggregated VPPAs through the Net Zero Consortium for Buyers (NZCB) in Q2 2024. We were pleased to announce one of the largest ever peer buyer organized aggregated VPPAs in Q2 for 180 MW of Southern Power Company’s Millers Branch solar project with seven NZCB participants. This announcement reflects the fact that the NZCB has achieved 86% of its goal of causing a gigawatt of new renewable energy capacity before 2025, which we are on track to achieve before the target year. Reaching NZCB’s gigawatt goal will generate enough energy to meet the annual average electricity needs of more than 200,000 U.S. homes while helping mitigate commercial Scope 2 emissions across the business operations of corporate buyers.
The NZCB General Quarterly Update
Most SR Inc Member-Clients, like most global companies, have geographically dispersed electric loads and are therefore keenly interested in the impact and scalability of VPPAs. This is particularly true in the U.S./Canada and the AIB countries in Europe, where GHG accounting rules allow them to source renewables and apply the associated energy attribute certificates to any sites within the respective boundaries. However, even when most SR Inc Member-Clients aggregate their load across the U.S. / Canada or the AIB countries in Europe, they still lack sufficient scale to command the most corporate buyer-favorable transaction structuring, ESG impact terms, and price when contracting through VPPAs.
Fortunately, SR Inc Member-Clients are able to come together with the assistance of SR Inc’s NZCB to create economies of scale, experience, and intellect. The NZCB’s auditable corporate procurement process and Reverse Auctions have become core to a growing number of SR Inc Member-Clients’ decarbonization strategies. SR Inc Member-Clients have made the NZCB the leading platform for corporate buyer aggregated procurement of utility-scale renewable energy in the U.S. as they help democratize their environmental and financial benefits, previously reserved only for the world’s largest energy users with geographically concentrated demand.
Overall conditions in the U.S. VPPA market have eased for corporate buyers in the last few quarters. As mentioned in the opening, in SR Inc’s aggregated procurements, we have returned to securing mature projects with full hub settlement, zero price floors, firm pricing, and shorter terms despite the fact that developers are continuing to face interconnection backlogs, tariffs, transmission constraints, concerns about basis risk, severe weather, insurance costs, and higher financing rates. These factors – in addition to record high corporate interest in long-term corporate contracting for to-be-built, utility-scale renewable energy – led to VPPA pricing remaining high in the U.S. market overall in Q2 2024. SR Inc is seeing early signs of easing solar supply chain pressures contributing to VPPA price stability or even price reductions, but will be monitoring tariff expansions and duty circumvention claims as well as progress towards onshoring domestic module manufacturing capacity ahead of our next quarterly update.
The growing concern about the reputational risks of unbundled RECs has been driving the increasing demand for purchaser caused RECs (a REC generated from a project caused by its procurement as part of a long-term transaction that enabled the project to get financed) for a few years now. Corporates are demonstrating a willingness to pay for more credible RECs from which they have unequivocal claims to having helped cause new renewable energy capacity to be built. Following the steep increases in 2023, the increases have been more modest in 2024. The modeled cost of buyer favorable, VPPA-sourced RECs (i.e., what SR Inc Member-Clients call purchaser caused RECs) rose $3.50 per REC on average across wind and solar in all U.S. hubs over the last year as the volume of closed VPPA transactions remains high (closed deals averaged 14GW/year in 2021-2023). While a year ago, the average modeled U.S. VPPA had a cost of $12.29, the average modeled cost in Q2 2024 approached $16 ($10.81 for solar and $20.75 for wind). SR Inc procurements achieve significantly better results than that due to professionally managed U.S. and European competitions culminating in Reverse Auctions that are shaped to benefit corporate buyers.
Another factor SR Inc’s NZCB monitors closely is historical and projected earned wind and solar prices across hubs. After a significant increase in our benchmark 22-year earned price indicator last quarter, in Q2, our 22-year earned price indicator increased another 1.1% for wind and decreased 1.0% for solar across active VPPA hubs. The increase in price might be indicative of the market awakening to substantial new electricity price demand drivers. Recent articles from The New York Times and The Wall Street Journal and studies from Wells Fargo, Goldman Sachs, S&P Global, The Brattle Group, and EPRI have highlighted a new surge in power usage driven by data center proliferation related to AI, continued movement to the cloud, cryptocurrency mining, onshoring of manufacturing, etc., which is driving unprecedented demand for both renewables and fossil fuels and will likely have an upward pressure on prices. Over the longer term, as the country electrifies and looks to emerging technologies like green hydrogen and battery energy storage, overall electricity demand is expected to continue to rise, increasing the need for clean energy and its associated infrastructure (estimates suggest electricity usage will increase 20% in the U.S. by 2030 and will double globally by 2050). This rise in demand is expected to be largely (or potentially more than) offset by downward price pressure due to more renewable energy (with zero marginal costs) being added to the grid.
To better quantify VPPA market dynamics in the U.S., the NZCB has published the NZCB VPPA Opportunity Index quarterly since 2019 to help advance SR Inc’s mission to accelerate the development and adoption of best practices in more sustainable business. The NZCB VPPA Opportunity Index enables a comparison of potential wind and solar VPPA performance across U.S. hubs using common analytics. It reflects both prior actual (backcast) performance and forward carefully modeled pricing and is based on proprietary SR Inc analytics and key data sources including those provided by SR Inc data providers LevelTen Energy and REsurety. We call readers’ attention to the fact that the Index is based upon VPPA offers, not executed transactions, that were made over the prior quarter.
Key findings from SR Inc’s NZCB Q2 analysis include:
- Top quartile offered wind VPPA prices across the country were up 10% on average from the previous 12 months, while offered solar VPPA prices were up 7%. However, some of the leading markets are beginning to show a downward trend. Most noticeably, offered ERCOT solar prices dropped 2%. We will be tracking this potential overall change in VPPA price trends during our active North American procurements to see if this market might follow the VPPA price decreases seen in Europe today.
- Realized electricity prices have continued to correct down to more historically typical levels. Average trailing 12 month (TTM) realized wind electricity prices in Q2 2024 were down 30% (to $25.63) across active hubs from the TTM in Q2 2023 and realized solar electricity prices were also down 36% (to $38.07) from Q2 2023.
- The combination of higher VPPA prices and lower realized prices caused expected cashflows in the TTM for a 10MW wind VPPA to drop from $(410)K in Q2 2023 to $(1.17)M in Q2 2024 (drop of $764K) and expected cashflows for a 10MW solar VPPA to drop from $91K in Q2 2023 to $(549)K in Q2 2024 (a drop of $640K).
- Our longer-term view Opportunity Index shows that average modeled cashflow through Q2 2039 per 10MW VPPA across active hubs dropped $17K in Q2 (to negative $708K) versus Q1 2024 for wind and dropped $11K (to negative $249K) for solar.
- In Q2, wind VPPAs modeled to be less expensive in 13% of all active hubs versus buying far less impactful unbundled RECs (based on the typical average cost today of $4.39 for a 10-year strip of unbundled RECs), and solar VPPAs modeled to be less expensive in 31% of all hubs.
- The average modeled hub annual cashflow for a 10MW wind VPPA would have been $450K more expensive than buying the equivalent number of less impactful unbundled REC strip, and the average modeled hub annual cashflow for a 10MW solar VPPA would have been $144K more
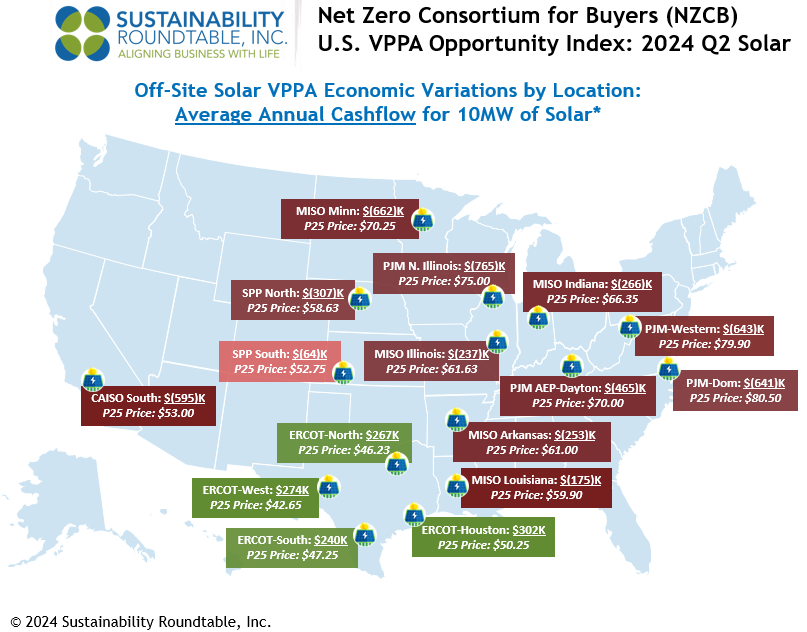
- Price modeling shows that ERCOT solar presented modeled opportunities for better than breakeven cash flow in Q2. The average modeled ERCOT annual cashflow for a 10MW solar VPPA was $271K.
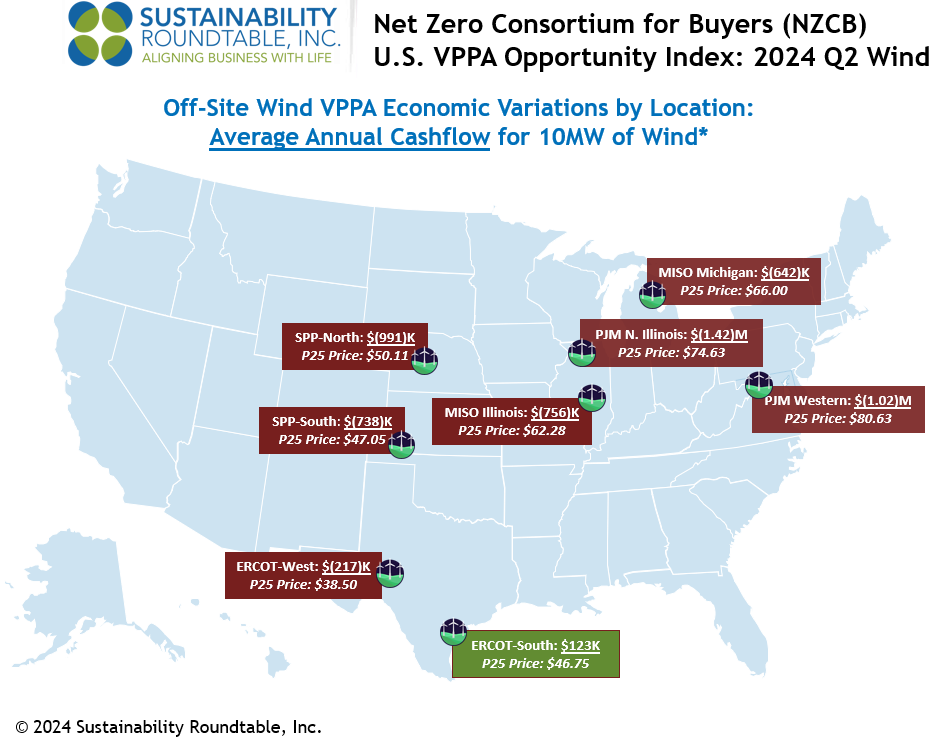
- For wind VPPAs in Q2, price modeling continued to show that ERCOT South presented modeled opportunities for better than breakeven cash flow in Q2, which was $123K per 10MW.
- To underscore the importance of NZCB’s procurement process, 2024 Q2 NZCB procurements for to-be-built solar in ERCOT were below the Q2 P25 VPPA prices for the same hubs despite also providing more than a dozen specially sought and secured buyer-favorable risk management terms required by conservative, environmentally motivated corporate procurement teams.
The NZCB VPPA Opportunity Index is an intentionally simplified rendering of complex markets, but NZCB participants find it helpful in beginning to gain an understanding of VPPA market dynamics and financial implications for implementing their renewable energy strategies through VPPAs and aggregated VPPAs. In pursuing any specific VPPA opportunities, SR Inc works with NZCB participants to provide deep stakeholder briefings and detailed and custom analytics before transacting. This type of assistance that VPPA offtakers need requires financial, legal, and market expertise to drive timely procurement strategy development and implementation, transaction structuring, contracting, and negotiation services to create a successful and auditable corporate procurement process in rapidly changing markets.
*Methodology
- To calculate average annual cashflows, SR Inc multiplies 1) the difference of technology-shaped realized market prices (2017-2024) & forecasted technology-shaped electricity futures market prices (2024-2039) versus top quartile VPPA prices in each hub by 2) the typical total annual production for 10MW offtakes for wind and solar, respectively.
- SR Inc uses 36K MWh production per year for 10MW of wind and 24K MWh per year for 10MW of solar to provide “apples to apples” comparisons for both technologies across hubs.
- The top quartile VPPA price assumes a scaled offtake of at least 50MW, but SR Inc uses 10MW because it is typically the minimum individual corporate offtake required within 100+ MW aggregated procurements REPS manages for NZCB participants.
Data Sources
- The NZCB Opportunity Index is developed from proprietary analytics and multiple data providers, which include:
- LevelTen Energy PPA Price Index North America top quartile VPPA pricing data for Q2 2024 (all proposed projects of 8+ years)
- REsurety REmap actual average, technology-shaped realized market prices for Q3 2017-Q2 2024 and technology-shaped future market price forecasts for Q3 2024-Q2 2039 (as of July 17, 2024) based on multiple electricity futures markets.
If you have any additional questions, or would like to learn more about the NZCB, contact info@sustainround.com.