January 14, 2022
Whether working with fellow SR Inc Member-Clients in the Net Zero Consortium for Buyers (NZCB) or with independent buyer advisory services, all sophisticated SR Inc Member-Clients are interested in the VPPA market as they chart paths to Net Zero Emissions globally. Every quarter since 2019, SR Inc has therefore been pleased to offer the NZCB VPPA Opportunity Index that enables a comparison of potential wind and solar VPPA performance across U.S. hubs using common analytics. The Index reflects both prior actual (backcast) performance and forward carefully modeled pricing. The Opportunity Index has been based on proprietary SR Inc analytics and key data sources including those provided by SR Inc partners LevelTen Energy and REsurety.
Key findings from our Q4 analysis include:
- Wind VPPA prices across the country were up 9.4% on average from the previous 12 months, while solar VPPA prices were up 10.7%.
- In the past quarter, average realized wind prices in Q4 2021 were up 114% across hubs from Q4 2020 (during the heart of Covid) and solar prices were up 96%.
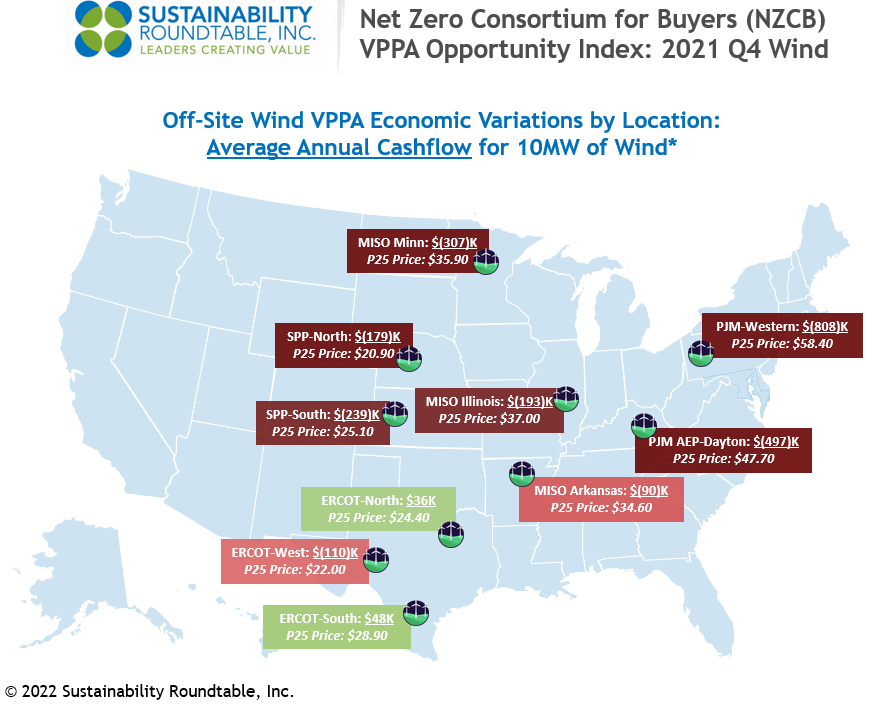
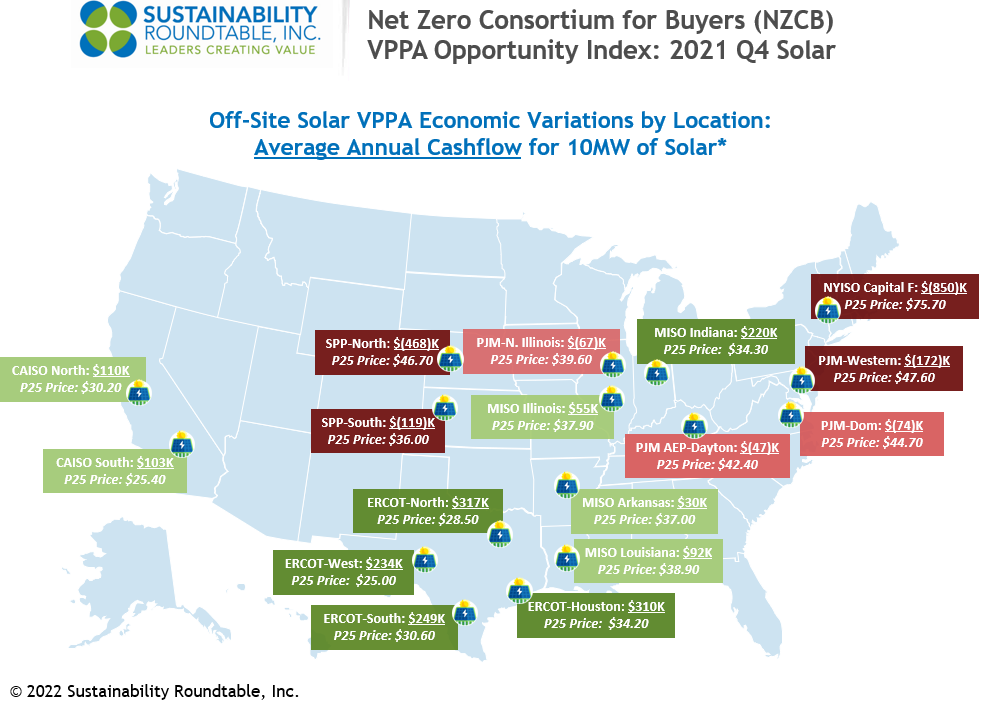
- Despite the last quarter realized price rises, our longer-term view Opportunity Index shows that average modeled cashflow through 2036 per 10MW VPPA across hubs was still down $18K in Q4 versus Q3 for solar but up $94K for wind.
- Due to the increased cost of unbundled RECs during 2020 and 2021 ($4.50 on average during Q4), price modeling indicates wind VPPAs would have been less expensive in 40% of the hubs versus buying unbundled RECs, and solar VPPAs would have been less expensive in 81% of the hubs.
- The average modeled hub annual cashflow for a 10MW wind VPPA would have been $72K more expensive than buying the equivalent number of unbundled RECs at today’s costs (there were a number of hubs with extreme negative cashflows pulling the average down significantly), and the average modeled hub annual cashflow for a 10MW solar VPPA (excluding the extreme negative cashflow in the New York hub) would have been $165K less expensive than buying the equivalent unbundled RECs at today’s costs.
- Price modeling shows that ERCOT (Texas) solar presented the strongest opportunities for positive cash flow in Q4. The average modeled ERCOT annual cashflow for a 10MW solar VPPA was $277K.
- Price modeling shows that ERCOT also continued to present the best opportunities for wind in Q4. However, due to the sharp VPPA price increases in Q4, the average modeled ERCOT annual cashflow for a 10MW wind VPPA was down to $(9)K.
- Price modeling shows that solar also presented cash positive opportunities in multiple MISO hubs (AR, IL, IN, and LA) in addition to CAISO (California) in Q4.
The NZCB VPPA Opportunity Index is an intentionally simplified rendering of complex markets, but NZCB participants find it helpful in beginning to gain an understanding of VPPA market dynamics and financial implications for implementing their renewable energy strategies through aggregated VPPAs. In pursuing any specific VPPA opportunities, NZCB participants require very detailed and custom analytics performed with senior expert assistance before transacting. This assistance requires financial, legal, and market expertise to drive timely procurement strategy development and implementation, transaction structuring, contracting, and negotiation services through a successful and auditable corporate procurement process.
Methodology
- To calculate average annual cashflows, SR Inc multiplies 1) the difference of technology-shaped realized market prices (2015-2021) & forecasted technology-shaped electricity futures market prices (2022-2036) & top quartile VPPA prices in each hub by 2) the typical total annual production for 10MW offtakes for wind and solar, respectively.
- SR Inc uses 36K MWh production per year for 10MW of wind and 26K MWh per year for 10MW of solar to provide “apples to apples” comparisons for both technologies across hubs.
- The top quartile VPPA price assumes a scaled offtake of at least 50MW, but SR Inc uses 10MW because it is typically the minimum individual corporate offtake required within 100+ MW aggregated procurements REPS manages for NZCB participants.
Data Sources
- The NZCB Opportunity Index is developed from proprietary analytics and multiple data providers, which include:
- LevelTen Energy PPA Price Index top quartile VPPA pricing data for Q4 2021 (all proposed projects of 8+ years)
-
- REsurety REmap actual average, technology-shaped realized market prices for 2015-2021 and technology-shaped future market price forecasts for 2022-2036 (as of January 13, 2022) based on multiple electricity futures markets.
If you have any additional questions, or would like to learn more about the NZCB, contact info@sustainround.com.